CRO / Ecommerce
What Is Ecommerce Conversion Rate Optimization? The Complete Guide
// the discipline everyone quotes and few companies actually own

By Fracto Solutions
September 1, 2026
The short answer
Conversion rate optimization is the structured process of turning more of your existing visitors into buyers, without spending more to acquire them. The global average sits at 2.66%, so most stores have real room to improve. The most common reason CRO programs stall isn’t technical, it’s that nobody is clearly accountable for the work.
Everyone in ecommerce has heard the term. Fewer can define it precisely, know where their own store sits against the global benchmark, or know that the biggest reason most CRO programs never get off the ground has nothing to do with technology.
What ecommerce CRO actually is
Conversion rate is completed orders divided by total visitors. CRO is the discipline of increasing that number without spending more to get the traffic.
What sits behind the number is what makes CRO a discipline rather than a single fix: page speed, product page clarity, trust signals, checkout friction, and whether the traffic itself was qualified in the first place.
Treating “improve conversion” as one project instead of five separate diagnoses is why so many stores test for months without moving revenue.
Who actually owns CRO at most companies?
Often nobody in particular, and that single gap explains more stalled CRO programs than any technical obstacle. The industry has improved on this, but it hasn’t solved it.
- The CRO maturity ladder
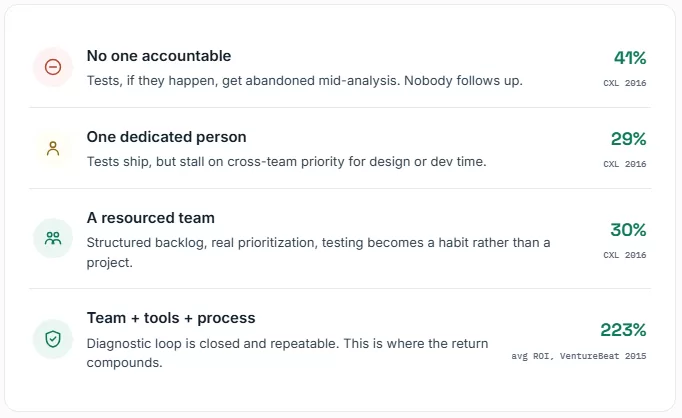
Ownership percentages: CXL, State of Conversion Optimization Report, 2016 (722 respondents). CXL’s 2018 follow-up found this had improved materially, with CRO owned by a person or team at over 60% of companies.
The 223% average ROI figure comes from a 2015 VentureBeat survey of 2,938 marketers, widely cited since; it is an aggregate outcome from that year, not a guarantee.
The ladder placement here is our interpretation rather than a finding of the study.
The number that explains most failed CRO efforts
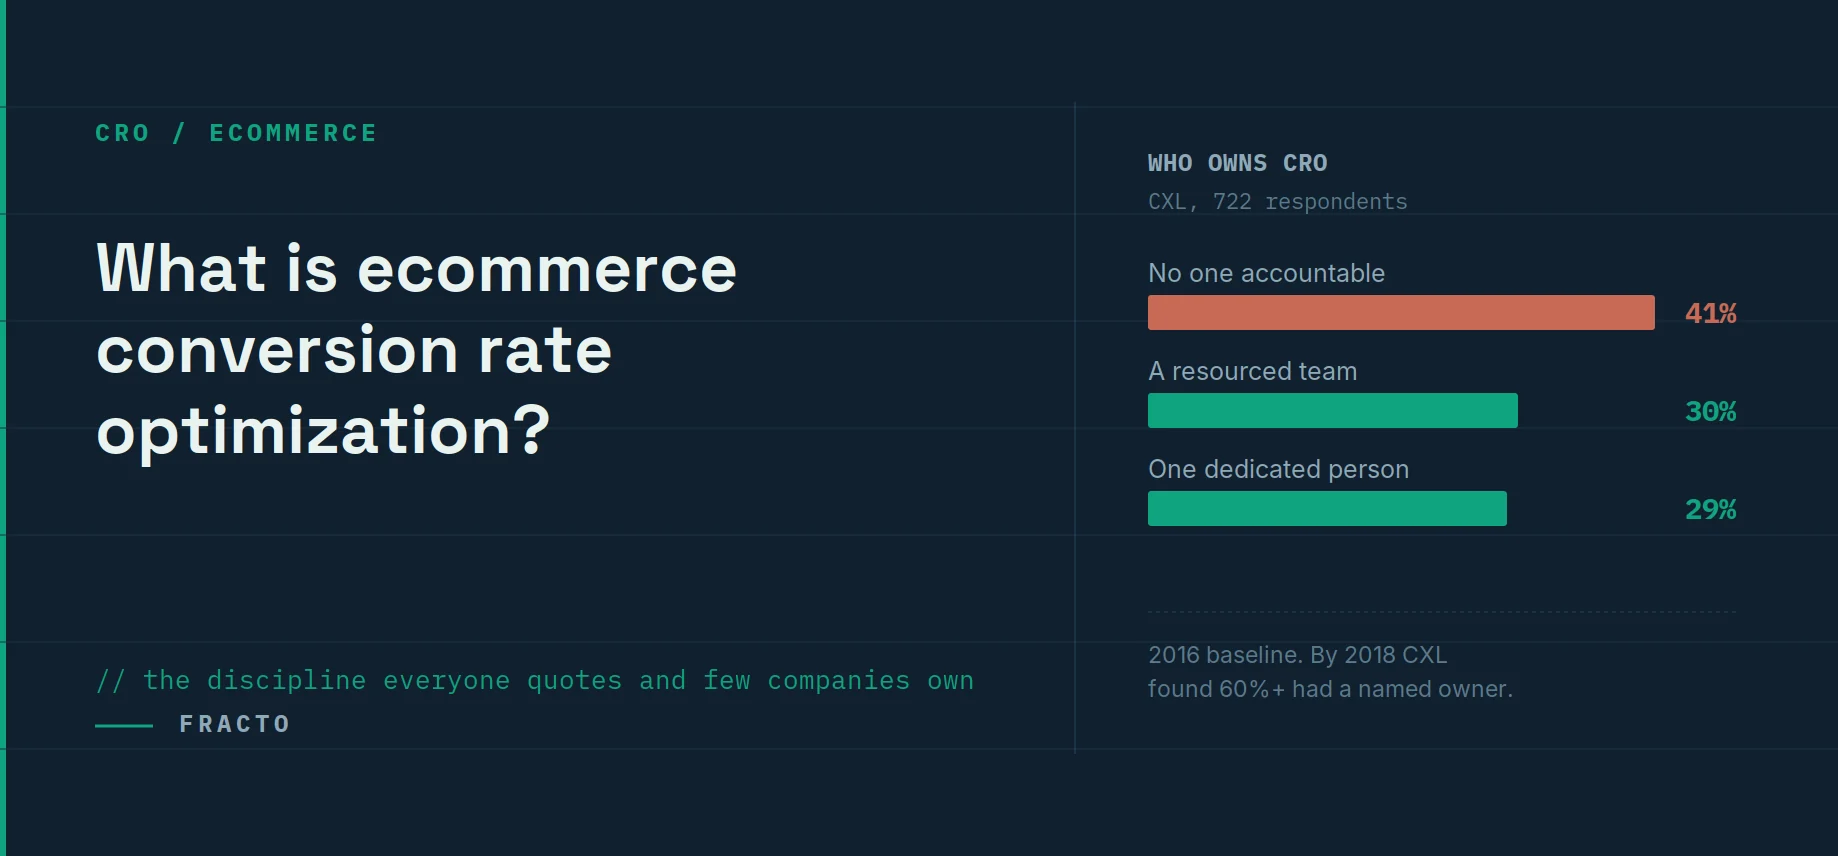
It isn’t a bad test or a wrong hypothesis. When CXL surveyed the field in 2016, 41% of companies had never assigned the work to anyone in the first place.
Its 2018 follow-up showed real improvement, with over 60% giving CRO to a named person or team, though 15.8% still said optimization was nobody’s primary job.
A test that nobody owns doesn’t get analyzed, doesn’t get followed up, and doesn’t compound into the next one
Where does the global average actually sit?
2.66%, according to Dynamic Yield’s benchmark across more than 400 brands. Most individual stores sit meaningfully below or above that, depending on platform and traffic mix.
- Benchmark context
1.4%
Average Shopify store conversion rate (Littledata)
2.66%
Global cross-platform average across 400+ brands (Dynamic Yield)
223%
Average ROI reported by companies using dedicated CRO tools (VentureBeat, 2015)
Littledata benchmark from a 2,800-site study, 2023. Dynamic Yield figure cited via Shopify, 2026. ROI figure from a VentureBeat survey of 2,938 marketers, 2015; it is not a CXL finding.
The five factors that hurt conversion rate most
Unclear value proposition, page speed, weak product pages, checkout friction, and broken tracking, in roughly that order of frequency.
Unclear value proposition. Visitors can’t tell within five seconds what the product does or why it beats the tab already open next to it.
Page speed. Every additional second before the page is interactive measurably reduces the odds a visitor stays.
Weak product pages. Missing size guides, thin reviews, no answer to “will this work for me.”
Checkout friction. Forced account creation, hidden shipping costs, too many form fields.
Broken or missing tracking. Measuring conversion accurately is itself a widely reported difficulty, so a share of “conversion problems” turn out to be analytics problems.
Is CRO the same as SEO?
No. SEO gets the right visitors to the site. CRO decides what happens once they land. They’re complementary, not interchangeable.
A page can rank first for its target keyword and still convert at half the category average. A page can convert excellently while getting almost no organic visibility. Diagnosing which one is actually broken should come before investing further in either.
What does fixing this actually pay back?
A widely cited VentureBeat survey from 2015 put average ROI at 223% for companies using dedicated CRO tools, though that figure assumes the work is actually owned and followed through, which the ownership data above suggests cannot be taken for granted.
- What separates programs that pay off
1.
2.
3.
Our synthesis, informed by CXL’s 2016 ownership findings; the 223% ROI figure is VentureBeat’s aggregate reported outcome across 2,938 marketers in 2015, not a guarantee for any single program.
How do you know whether a change actually worked?
By deciding what counts as success before the test runs, and by letting it run long enough to be believable. Most CRO failures are measurement failures, not idea failures.
Three habits separate a test you can act on from one you can only argue about.
Pick the metric before the test, not after. Conversion rate alone is easy to move in the wrong direction. Cut a shipping threshold and conversion rate rises while revenue per visitor falls. Track revenue per visitor and average order value alongside it, and decide in advance which one wins if they disagree.
Give it a full business cycle. Traffic behaves differently on a Tuesday than a Sunday, and differently in the week after payday. A test stopped the moment it looks good is usually measuring a good week rather than a real effect.
Change one thing at a time. If you rewrite the product page, shorten the checkout, and retarget the ads in the same fortnight and revenue moves, you have learned nothing about which one earned it, and you will carry all three forward whether or not they helped.
There is an honest constraint here worth naming: A/B testing needs enough traffic and enough conversions to reach a reliable result in a sensible timeframe. Below that, you are not running experiments, you are reading noise.
That does not mean smaller stores can’t do CRO. It means the evidence comes from session recordings, funnel drop-off, and direct customer feedback rather than from statistical significance, and changes get made on judgment rather than proof.
Where to start if you have never done this
Verify your data first, then find the single steepest drop-off, fix that one thing, and measure it. Repeat.
The sequence matters more than the tooling, and it is deliberately unglamorous:
1.
Confirm tracking is telling the truth. Place a real test order and check it reaches both your platform and your analytics. If your numbers are wrong, everything downstream is guesswork with extra steps.
2.
Find the steepest drop. Read your funnel from sessions through to completed orders. The largest gap between two adjacent steps is where to look, and it tells you which of the five factors above is actually yours.
3.
Watch real sessions. Twenty or thirty recordings of visitors who left will usually surface the friction faster than a month of dashboards.
4.
Fix one thing, then measure. Resist the urge to ship a redesign. The point of the loop is to learn what moves your particular store, and a redesign teaches you nothing except that something changed.
5.
Assign it to someone. Given the ownership data above, this is the step most often skipped, and the one that determines whether steps one through four ever happen twice.
What does CRO cost, hiring out versus building in-house?
Agency retainers typically run $2,000 to $25,000+ a month depending on scope. An in-house specialist averages roughly $73,000 a year; a manager, roughly $121,000.
- Two ways to staff CRO
In-house hire
CRO specialist, avg. US salary $73,098/yr
CRO manager, avg. US salary $121,359/yr
Plus tooling, testing platform, headcount overhead
Fixed cost
regardless of testing volume
Agency retainer
Typical range $2,000 to $25,000+/mo
Scales with scope and testing cadence
Solves the ownership gap by design, someone is contractually accountable
Variable cost
scales with the work itself
In-house salary figures: salary.com, Aug 2026, US national averages. Agency pricing range: industry CRO pricing guide, 2026. A 30%-of-marketing-budget rule of thumb circulates widely, but it travels through secondary roundups rather than a primary survey, so we treat it as a talking point rather than guidance.
Below a certain traffic threshold, agencies typically get to results faster: a specialist’s pattern recognition across many stores substitutes for the sample size a single store can’t generate on its own, and the retainer structure itself solves the accountability gap that stalls so many internal efforts.
Above that threshold, and with sustained testing demand, an in-house hire’s fixed cost can pay for itself, provided the role is given explicit, resourced ownership rather than added onto someone’s existing job.
We find the leak, fix it, and prove the gain in your own numbers.
Our conversion optimization work audits your data, funnel, and channels to find where revenue is actually leaking, the biggest leaks first, then validates the lift in your own analytics rather than a vanity dashboard. Ownership doesn’t slip through the cracks because it’s contractually ours to follow through on.
On one engagement, a rebuilt buying path lifted conversion 6% and revenue per visitor 7%, both A/B tested at 95% confidence.
Frequently asked questions
Is CRO a one-time project or ongoing work?
Both exist. An audit and initial fix round is project-based. Testing and refinement afterward is ongoing, since traffic mix and customer behavior shift over time.
Who is actually responsible for CRO at most companies?
In CXL’s 2016 State of Conversion Optimization Report, 41% of companies had no one in particular accountable, 30% assigned it to a team, and 29% to a single dedicated person. CXL’s 2018 follow-up found this improved, with over 60% giving CRO to a named person or team.
How is CRO different from a redesign?
A redesign changes the whole site and resets your data. CRO targets specific, diagnosed friction points without starting over.
Is CRO the same as SEO?
No. SEO gets visitors to the site. CRO determines what happens once they arrive. A page can rank well and convert poorly, or the reverse.
What return does CRO actually generate?
Companies using dedicated CRO tools reported an average ROI of 223% in a widely cited VentureBeat survey of 2,938 marketers, published in 2015, though this varies significantly by how mature and well-owned the testing program is.
Sources
CRO ownership structure (41% no one accountable, 30% team, 29% single person) — CXL, 2016 State of Conversion Optimization Report, 722 respondents. Its 2018 report found ownership had improved, with over 60% assigning CRO to a person or team and 15.8% saying it was nobody’s primary job.
Average ROI of 223% for companies using CRO tools — VentureBeat (VB Insight) survey of 2,938 marketers, 2015; average reported as 223.7%. Widely cited since, including by CXL, but not a CXL primary finding. An eleven-year-old figure about the CRO tool market of that period.
Global ecommerce conversion rate average, 2.66% across 400+ brands — Dynamic Yield, cited via Shopify, 2026.
Shopify store average conversion rate, 1.4%, from a benchmark of 2,800 Shopify sites studied in 2023 — Littledata.
CRO agency pricing range, $2,000 to $25,000+/month — Conversion Rate Optimization Pricing Guide, 2026. Single-source industry guide; agency pricing is not systematically surveyed, so treat this as an observed range rather than a benchmark.
In-house CRO specialist average salary, $73,098/yr — Salary.com, Aug 2026. CRO manager average, $121,359/yr — Salary.com, Aug 2026. Both are US national averages and are revised monthly.