Conversion / Shopify
How to Reduce Cart and Checkout Abandonment on Shopify
// reduce friction, recover carts, prove the lift

By Fracto Solutions
July 29, 2026
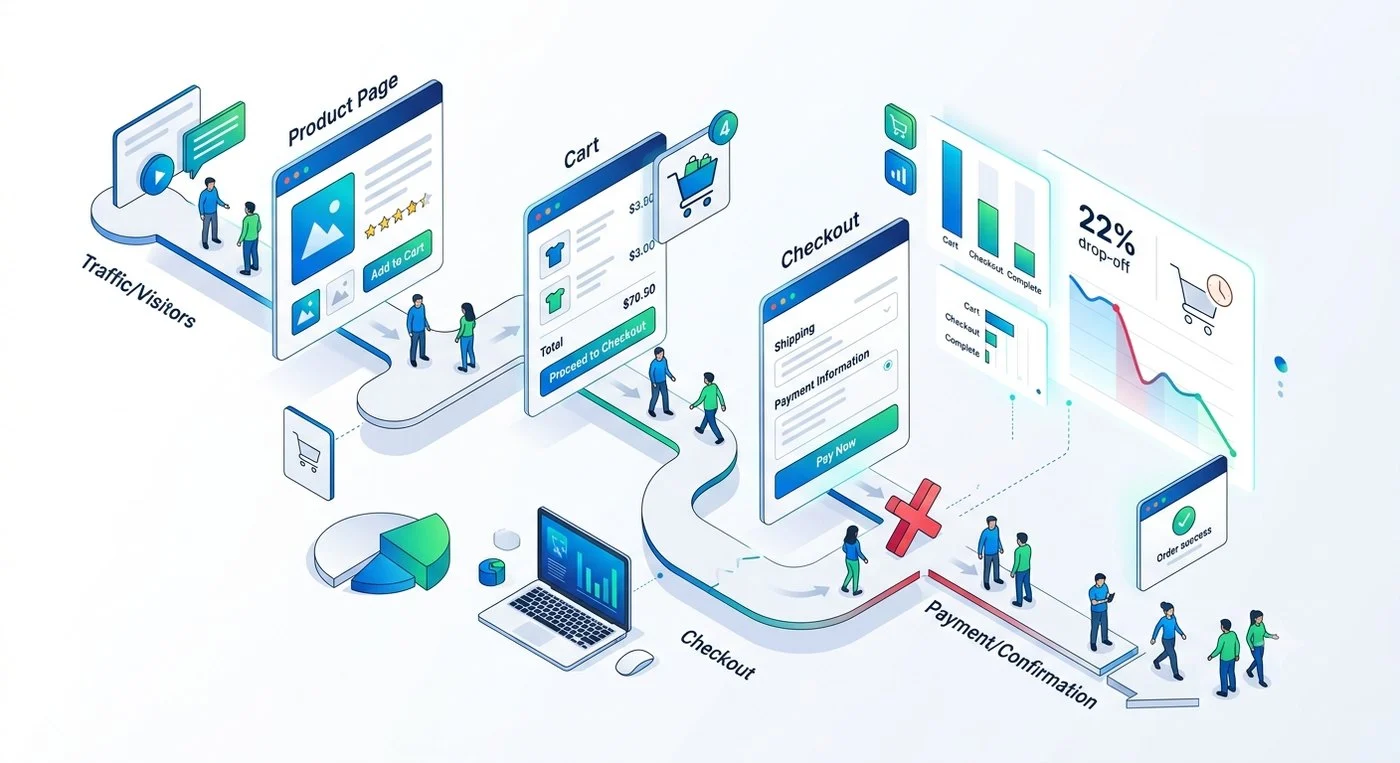
Every step between the product page and the payment confirmation is a place to lose a buyer. The job is finding which step is costing you most.
The short answer
Here is how to reduce cart abandonment on Shopify: remove the friction that stops ready buyers: show the full cost early, offer guest checkout, cut unnecessary form fields, add express payment options, and fix mobile checkout speed. Recovery emails come second. Around 70% of carts are abandoned, but a large share of that is fixable.
Most Shopify stores lose people somewhere between the cart and the payment screen. You’re not going to get that number to zero, and you shouldn’t try. Some shoppers will always compare prices, save things for later, or wander off. The money is in the other group: people who wanted to buy and left anyway because something got in the way.
This guide covers what actually causes that, which fixes move the number most, and how to find the specific step where your own checkout is losing people.
What counts as a normal cart abandonment rate for Shopify stores?
Around 70% is normal, and there’s no single “good” number that applies to every store.
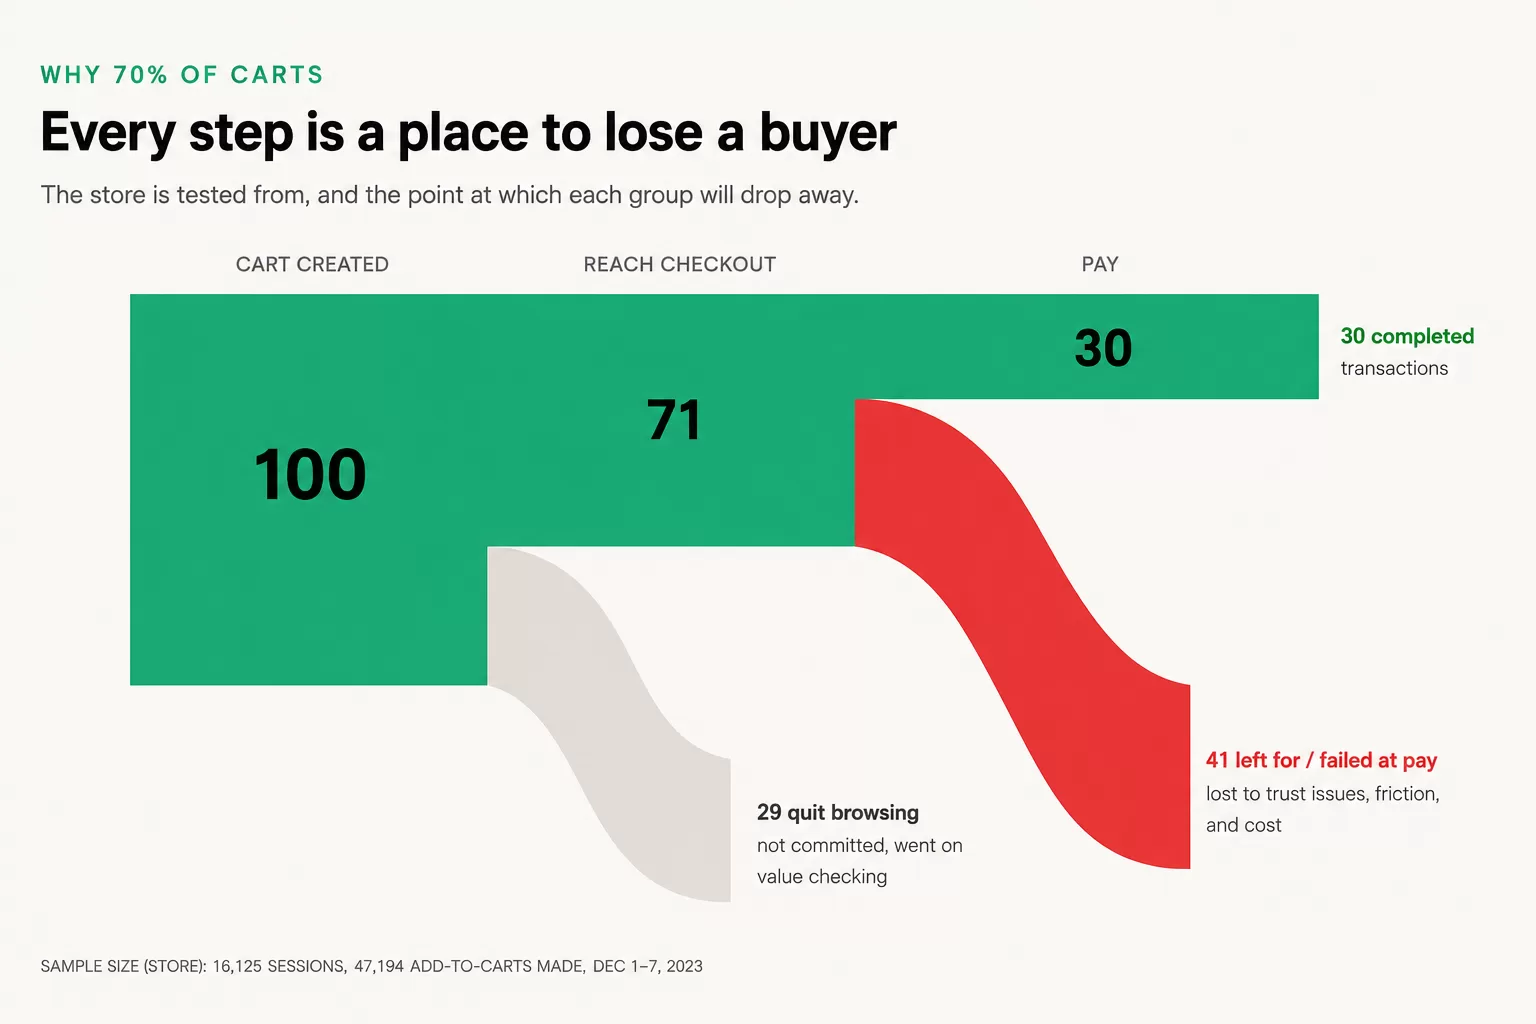
Baymard Institute puts the average documented cart abandonment rate at 70.22%, calculated across 50 separate studies. So roughly seven in ten people who add something to a cart leave without buying. That figure blends industries, devices, and buying behaviors, which is exactly why it works better as context than as a target.
A big slice of it isn’t recoverable at all. In Baymard’s survey of US online shoppers, 42% said they abandoned a cart simply because they were browsing and not ready to buy. Chasing those people is mostly wasted effort.
The group worth your attention is everyone else: shoppers who had intent and hit something that stopped them. So rather than aiming at a benchmark, measure your own drop-off between cart, checkout, and payment, then work on the step that leaks hardest.
Why do Shopify customers abandon carts?
Because of unexpected costs, checkout friction, or a trust wobble at the exact moment they’re ready to pay.
Set aside the “just browsing” group and Baymard’s data gives a clear ranking of the reasons people bail:
- 40% left because extra costs were too high (shipping, tax, fees)
- 20% left because delivery was too slow
- 19% didn't trust the site with their card information
- 18% were told they had to create an account
- 17% found the checkout too long or complicated
- 17% hit a site error or crash
Read that list as a whole and a pattern shows up: almost none of it is about the product. These shoppers already chose the thing. What broke was the experience between choosing it and paying for it, and nearly every item on that list is something you control.
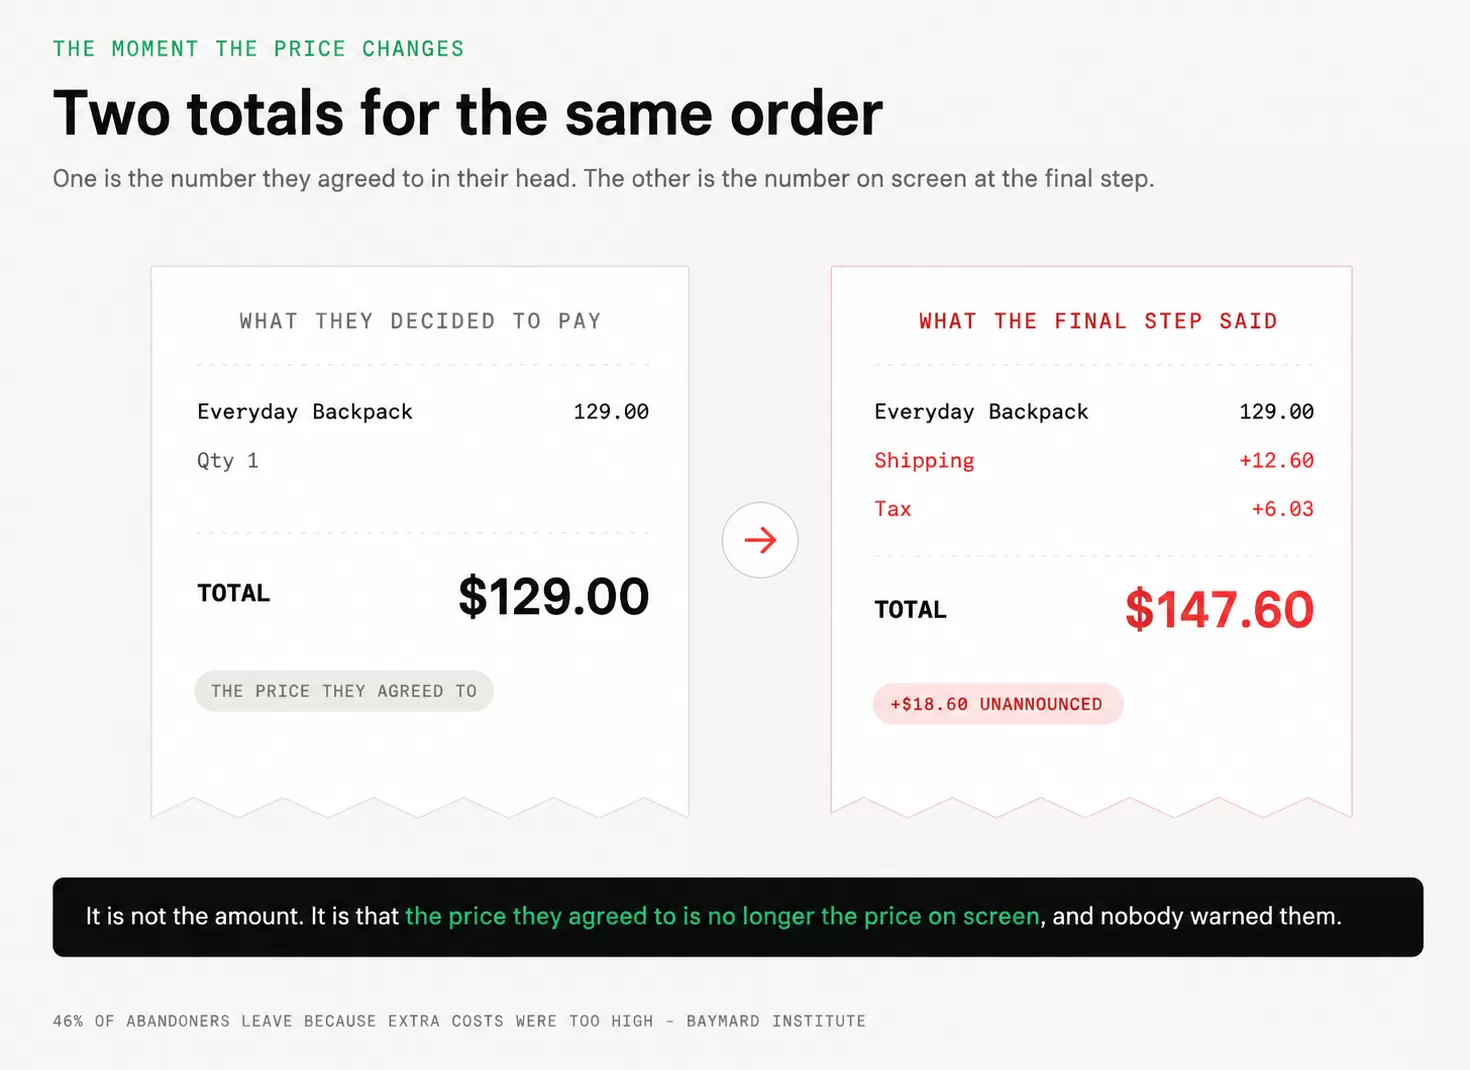
Cost transparency is the headline. Someone decides to buy at $50, reaches the final step, and finds shipping and tax bolted on. It isn’t only the amount, it’s the surprise. The price they agreed to in their head is no longer the price on screen.
Cart and checkout abandonment benchmarks
- 2026 benchmarks
Metric
Figure
Source
Average cart abandonment rate
70.22%
Baymard Institute, 50 studies
Abandon because they were just browsing
42%
Baymard Institute
Abandon due to extra costs being too high
40%
Baymard Institute
Abandon due to slow delivery
20%
Baymard Institute
Abandon due to not trusting the site with card details
19%
Baymard Institute
Abandon due to forced account creation
18%
Baymard Institute
Abandon due to a long or complicated checkout
17%
Baymard Institute
Avg. form elements in a US checkout (vs 12 to 14 ideal)
23.48
Baymard checkout database
Order value recoverable via better checkout design (US + EU)
~$260bn
Baymard Institute
Fracto client result: buying-path rebuild (one Shopify portfolio)
+5% checkout starts, +3% add-to-cart
Fracto engagement, 95% confidence A/B test
Sources: Baymard Institute, Cart Abandonment Rate Statistics (page last updated September 22, 2025; figures verified against the live page July 25, 2026). Final row: one Fracto client engagement, A/B tested at 95% confidence. Client remains anonymous.
How to calculate your shopping cart abandonment rate?
The shopping cart abandonment rate is the share of shoppers who add items to their cart and never complete a purchase. The calculation is simple: divide completed purchases by carts created, subtract that from one, and multiply by 100. If 1,000 people add items to their cart in a month and 260 of them buy, your rate is 74%.
Shopify gives you the inputs without any extra tooling. Open Shopify Analytics, then the conversion rate breakdown, and read the four stages: sessions, added to cart, reached checkout, and sessions converted. The gap between added to cart and reached checkout is your cart abandonment. The gap between reached checkout and converted is your checkout abandonment, which is a different problem with different fixes.
Track both separately. A store losing potential customers between the cart and the checkout page usually has a cost or shipping problem, because that is the moment totals become real. A store losing them inside the checkout page itself usually has a form, payment, or trust problem.
Measure the two numbers weekly rather than daily, and read them against your own trend rather than the 70% average. A store at 78% that was at 84% last quarter is winning. A store at 68% that was at 61% is not, whatever the benchmark says.
If your store sells a subscription or a high-consideration product, expect a higher number and do not read it as failure. Longer decision cycles mean more carts created per eventual purchase, and the useful comparison stays your own trend.
01.Show shipping and total cost earlier
Extra costs are the single biggest fixable reason people leave, so stop saving the real total for the last screen.
Put estimated shipping on the cart page. Show tax where you can. Give delivery timelines before checkout rather than during it. If you run a free shipping threshold, say so in a way that helps: “you’re $12 away from free shipping” turns a cost into a reason to add one more item.
02.Turn on guest checkout
Nearly one in five shoppers walks when a store demands an account first. That’s a barrier you’re choosing to keep.
Let people buy, then offer the account afterward, when they’ve already got a reason to want one. Buying should feel like buying, not like signing up for a service before you’re allowed to pay.
03.Cut checkout fields
Every extra field is another chance to lose someone. Baymard’s benchmark database finds the average US checkout puts 23.48 form elements in front of a buyer, while a well-built flow can run at 12 to 14.
Go through yours and strip anything you don’t genuinely need. Turn on address autofill, drop duplicate questions, and stop collecting data you’re not going to use.
Reduce the number of steps between the cart and the payment screen
Field count is one problem. Step count is a separate one, and it is easier to miss because each individual step looks reasonable.
A default Shopify buying path can run to five or six screens: product page, cart page, contact information, shipping, payment, and review. Each screen is an opportunity to reconsider, and every additional load is another moment where a slow connection or a mistyped field ends the session. Reduce the number of steps and you shorten the window in which a decided buyer can change their mind.
Practical ways to compress the checkout process include adding to cart directly from collection pages with a quick-view, so browsing does not require a round trip through every product page. Offer a buy-now path that skips the cart page entirely for single-item purchases. Use a slide-out cart drawer instead of a full cart page load. Turn on Shop Pay, which returns a recognized shopper straight to a review screen instead of asking for an address and credit card details again. Where your theme allows it, combine contact and shipping into one screen.
Do not confuse fewer steps with hiding information. Costs still need to appear early, and a guest checkout option still needs to be visible on the first screen rather than buried under an account prompt. The goal is fewer loads and fewer decisions, not less clarity about what the shopper is agreeing to.
04.Add express and familiar payment options
Typing card details on a phone is miserable. Shop Pay, Apple Pay, and Google Pay remove most of that work, and 19% of abandoners cite not trusting a site with their card, so a payment method people already recognize does double duty on trust.
05.Put trust signals where the decision happens
At the payment step, the question in someone’s head is simple: do I trust this store enough to hand over a card? Answer it in place, with the return policy, delivery expectations, secure payment messaging, and support availability visible right there. The goal isn’t a wall of badges, it’s removing the last hesitation.
Catch people before they leave with exit intent
Recovery emails reach shoppers hours later, while exit intent tries to hold them while they are still on the page.
An exit intent trigger fires when a visitor’s cursor moves toward the browser controls on desktop, or when scroll behavior on mobile suggests they are about to leave. What you show at that moment matters more than the mechanism. A generic discount popup trains people to abandon carts on purpose, and it costs you margin on shoppers who were going to buy anyway.
Better uses of the same trigger include surfacing the information that stopped them, such as the return policy, delivery date, or a shipping estimate for their location. You can also offer to email the cart rather than offering money off, which captures the address without discounting the order. Another option is to answer the objection your analytics already flagged. If extra costs are your top drop-off reason, show the full total with shipping included rather than a coupon.
Exit intent also works outside the cart. On a product page, it can surface sizing help or stock information for potential customers who are still deciding, which is a gentler ask than a discount.
Treat it as a supplement, not a fix. If your checkout ambushes people with costs at the final screen, an exit popup is a bandage over a wound you control. Building trust earlier in the path, with clear totals and visible policies, removes the need for the interruption in the first place.
How do I recover abandoned carts on Shopify?
With a short email sequence, though recovery is the smaller half of the job.
A workable flow is three messages: a reminder soon after abandonment with a direct link back to the cart, a second that answers the objections people actually have around shipping, returns, and sizing, and a final message that can carry an incentive if the margin supports it.
Shopify’s built-in abandoned checkout recovery handles the basics, and Klaviyo gives you more control over segmentation and timing.
Just don’t let recovery become the strategy. Recovery emails win back a slice of the people you already lost. Fixing the checkout improves every single order that comes after, including the ones from people who’d never open an email.
How do I find where my Shopify checkout is leaking?
Read the funnel first, then watch real sessions at the step that leaks.
Open Shopify Analytics and follow the sequence: product page, add to cart, checkout started, payment completed. Where the drop-off clusters tells you what kind of problem you have.
- Low add-to-cart rate points upstream, at the product page or the traffic itself
- Add-to-carts that don't reach checkout point at the cart, usually cost or shipping
- Reaching checkout without completing points at payment, trust, or friction inside the checkout
- The checkout funnel, in Shopify Analytics
Drop in a real, cropped funnel screenshot so readers can see the four steps and where the drop-off sits.
Then go watch people. Session recordings in Microsoft Clarity, which is free, surface things numbers can’t: a shipping line nobody notices, a button that does nothing on mobile, the pause and scroll-back that means someone is hunting for the return policy. Twenty to thirty recordings of people who left is usually enough to tell you which of the reasons above is yours.
For a fuller walkthrough of that diagnostic process, see our guide on how to diagnose Shopify conversion issues.
Does site speed affect cart abandonment?
Yes, particularly on mobile, and it’s worth treating as its own workstream.
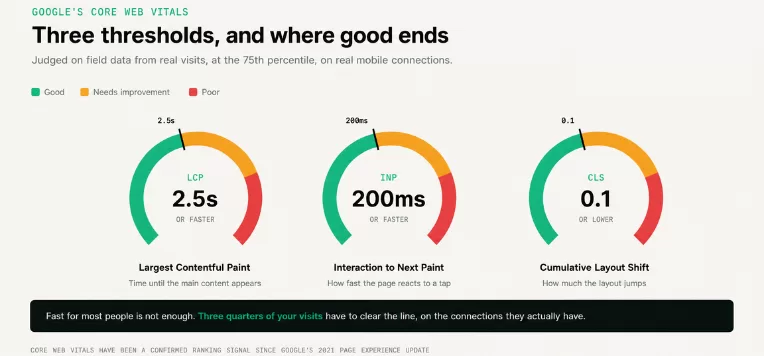
Slow pages add friction everywhere, and Deloitte’s work with Google found that a 0.1 second improvement in mobile site speed lifted retail conversion rates by 8.4% and average order value by 9.2%. On Shopify, the usual culprits are heavy apps, oversized images, and stacked tracking scripts.
We cover measurement, Core Web Vitals thresholds, and the specific Shopify fixes in how Shopify speed impacts conversion rate, so this article stays on checkout design.
Each leak maps to a service we own in-house.
We find the leaks, fix it, and prove the gain in your own numbers.
This starts with finding where people actually leave, not with a list of best practices applied on faith. We map the full path: product page behavior, cart interactions, checkout funnel performance, session recordings, and whether the tracking underneath it can even be trusted. Then we fix the biggest leak first and prove the change with a real test.
One recent engagement shows the shape of it. We rebuilt a Shopify client’s buying path, including the product page, a collection quick-view with add-to-cart, and a persistent sticky add-to-cart, so shoppers reached checkout in fewer clicks. Checkout starts rose 5% and add-to-cart rose 3%, both A/B tested at 95% confidence, so the lift came from the change rather than a good month.
Frequently asked questions
How to reduce cart abandonment on Shopify without discounting?
Start with cost transparency and checkout length rather than coupons.
Showing shipping on the cart page, enabling guest checkout, and cutting
form fields address the top three documented reasons people leave, and
none of them cost you margin on shoppers who were going to buy anyway.
What is an average cart abandonment rate for Shopify?
Around 70% is the documented average, according to Baymard Institute. The right benchmark for you depends on category, traffic source, and device mix, so improving your own drop-off between cart, checkout, and payment matters more than hitting a published number.
Why do Shopify customers abandon checkout?
Excluding shoppers who were only browsing, the leading reasons are extra costs that are too high (40%), slow delivery (20%), not trusting the site with card details (19%), forced account creation (18%), and a checkout that’s too long or complicated (17%).
Does guest checkout reduce cart abandonment?
Yes. Baymard’s data shows 18% of shoppers abandon because a site made them create an account. Allowing guest checkout removes that barrier without costing you anything.
Does Shop Pay help reduce checkout abandonment?
It helps most on mobile, where typing card details is the slowest part of buying. Express payment options cut that effort and carry recognition, which also addresses the 19% who don’t trust unfamiliar sites with their card.
Should I fix checkout problems or run abandoned cart emails first?
Fix checkout first. Recovery emails win back some of the people you already lost, while a better checkout improves every order that follows.
How much revenue is actually recoverable?
Baymard estimates roughly $260 billion in order value across the US and EU could be recovered through better checkout flow and design alone, based on a documented 35.26% potential conversion increase for large ecommerce sites.
Keep reading
Sources
Baymard Institute, Cart Abandonment Rate Statistics (page last updated September 22, 2025): 70.22% average across 50 studies; just browsing 42%; excluding browsing, extra costs 40%, slow delivery 20%, card distrust 19%, forced account creation 18%, long or complicated checkout 17%; average US checkout contains 23.48 form elements against 12 to 14 in an ideal flow; ~$260 billion recoverable across the US and EU · baymard.com
Deloitte with Google, “Milliseconds Make Millions”: a 0.1 second improvement in mobile site speed increased retail conversion rates by 8.4% and average order value by 9.2%.
Littledata, Shopify conversion rate benchmark (2023, 2,800 stores): 1.4% average, top 20% above 3.2%, top 10% above 4.7% · littledata.io