Conversion / Shopify
Shopify CRO: The Complete Guide to Optimizing Your Store
// more from the traffic you already have

By Fracto Solutions
September 2, 2026
The short answer
Shopify CRO is the practice of turning more of your existing visitors into buyers, rather than buying more traffic. The biggest levers, in order, are usually checkout, mobile experience, site speed, and product pages. The average Shopify store converts at 1.4%; a good rate is 3.2% or higher. Fix your worst leak first.
Conversion rate optimization is how you get more revenue from the traffic you already pay for. For most Shopify stores it’s the highest-return work available, because the visitors are already arriving, they’re just leaving without buying. This guide pulls the whole picture together and links out to deeper guides on each piece.
What is Shopify CRO?
The systematic process of increasing the percentage of visitors who complete a purchase, through evidence, not guesswork.
CRO isn’t a redesign or a pile of tips; it’s a loop: measure where visitors drop, hypothesize why, test a change, keep what wins. Your conversion rate is orders divided by sessions, and CRO moves that number up by removing the specific friction costing you sales.
That definition has a practical edge to it. There are only two ways to sell more: bring more people in, or lose fewer of the people already arriving. The first has a rising cost, because every extra visitor is bought at auction and the cheapest audiences get used up first. The second has a fixed cost and a permanent payoff, because a fixed leak stays fixed for every future visitor. That’s why CRO improves the return on all your traffic at once, paid, organic, email and direct together, and compounds in a way buying more ads never does.
It’s worth being clear about what CRO is not. It isn’t a redesign, it isn’t a checklist of best practices applied on faith, and it isn’t a set of tricks like countdown timers that borrow a short-term lift from long-term trust. It’s a diagnosis followed by a fix you can prove.
What is a good conversion rate for a Shopify store?
The average Shopify store converts at about 1.4%. A good rate is 3.2% or higher (top 20%); 4.7% or higher is excellent (top 10%).
- Shopify conversion tiers (Littledata, 2,800 stores)
Tier
Session Conversion rate
Average (mean)
1.4%
Good (top 20%)
3.2% or higher
Excellent (top 10%)
4.7% or higher
This is session-based (what Shopify Analytics shows); a visitor-based number looks higher. “Good” also varies by industry: in Littledata’s Shopify data, food and beverage averages about 1.5% (its top 10% clear 6.2%) and fashion about 1.9%. Compare against your own category, and check whose data you are comparing to, since cross-brand datasets like Dynamic Yield run much higher than Shopify-only ones. Full detail in what is a good conversion rate and the industry benchmarks.
Why is my store getting traffic but not converting?
Almost always friction in the buying path, most often checkout or mobile, or traffic that doesn’t match your offer. It’s rarely a mystery.
Before assuming the site is broken, check that your tracking is telling the truth. A surprising share of “conversion problems” turn out to be measurement problems: a duplicated tag, a checkout event that stopped firing after a theme update, or orders landing in Shopify but never in analytics. Place a real test order and confirm it reaches both. If your numbers are wrong, everything downstream is guesswork with extra steps.
Once the data is trustworthy, the cause is usually one or two fixable things. Surprise costs at the final screen break the price the shopper already agreed to in their head. A clunky mobile experience costs you most, because mobile carries the majority of traffic and already converts lower than desktop. Slow pages lose people before they engage at all. Thin product pages leave the question “will this work for me” unanswered, so the shopper leaves to think about it. Missing trust signals stall the decision at the exact moment a card comes out.
Sometimes it isn’t the site at all. If your ads promise one thing and the landing page shows another, or your traffic is broad and low-intent, no amount of page optimization will rescue it. The way to tell which of these is yours is to diagnose, not guess: read your funnel from sessions through to completed orders and find the steepest single drop. See traffic but no sales and how to diagnose conversion issues.
What are the biggest levers to improve conversion?
In rough order of impact: checkout, mobile, site speed, product pages. Fix the biggest leak first.
- The biggest conversion levers
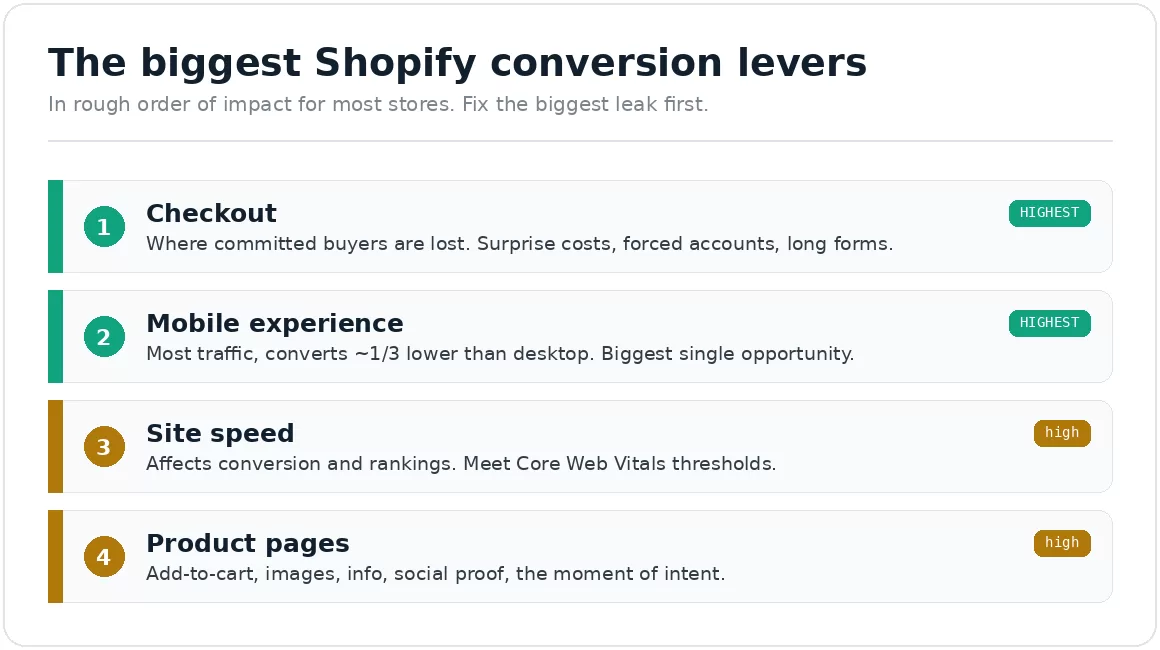
In rough order of impact for most stores. Checkout and mobile lose the most, so they’re highest priority.
Checkout is where committed buyers are lost, top abandonment reasons (excluding browsing) are extra costs (40%), slow delivery (20%), card-security distrust (19%), forced accounts (18%), long checkout (17%). Full method in the checkout framework. Mobile converts ~1.2% vs desktop’s 1.9% yet carries most traffic. Speed affects conversion and rankings (Core Web Vitals: LCP under 2.5s, INP under 200ms, CLS under 0.1, each measured at the 75th percentile of real visits), see speed and conversion. Product pages: add-to-cart, images, info, social proof, see optimizing product pages.
How do I actually run the CRO process?
A repeatable loop: measure, prioritize, hypothesize, test, keep what wins. The discipline is what separates real CRO from random redesigns.
Measure. Analytics tells you where visitors leave; session recordings tell you why. You need both, because a funnel report can show you that half your shoppers abandon at checkout without ever showing you the shipping line they didn’t notice. Twenty or thirty recordings of people who left usually surfaces the friction faster than a month of dashboards.
Prioritize. Rank the leaks by revenue at stake and effort to fix, not by what’s interesting. A small lift on a page that every buyer passes through is worth more than a large lift on a page almost nobody sees. This is the step most internal efforts skip, and skipping it is why backlogs fill with changes that were easy rather than valuable.
Hypothesize and test. State the change, the reason you expect it to work, and the metric that decides it, before you ship. Decide in advance which number wins if two disagree, because cutting a shipping threshold can lift conversion rate while revenue per visitor falls. Where traffic supports it, A/B test so the lift is real rather than a good week. Where it doesn’t, change one thing at a time and judge it against your own trend.
Keep what wins, then repeat. Winners get kept and built on, losers get documented so nobody retries them in six months. The compounding comes from the loop running again, not from any single change. A structured CRO audit sets this up by finding and ranking the leaks in the first place.
How long does Shopify CRO take to show results?
Some fixes move conversion within days; reliable A/B-tested wins usually take a few weeks, because a test needs enough traffic to reach statistical significance before you can trust the result.
It helps to separate two kinds of change. Obvious fixes, showing shipping costs earlier, enabling guest checkout, making the add-to-cart visible on mobile, remove known friction and can lift conversion almost immediately, because you’re not testing whether they help, you’re correcting a clear problem. Experiments are different: to know a change genuinely improved conversion rather than got lucky with a good week, the test has to run until it reaches significance, which depends on your traffic and the size of the lift. A store with modest traffic chasing a small lift may need several weeks per test; a high-traffic store testing a bold change can conclude faster.
That’s why CRO is framed as a compounding program, not a one-off project. Each cycle, fix, measure, keep what wins, adds a durable gain that pays out on every future visitor, and the wins stack over months. The honest expectation is quick relief from the obvious leaks, then steady, tested improvement after that. If a provider promises a guaranteed percentage lift by a fixed date, treat it with caution, real CRO reports what the data shows, including the tests that don’t win.
Do I need a redesign or just CRO?
Usually CRO, not a redesign. A redesign is expensive, slow, and risks discarding what already works. Targeted optimization is cheaper and lower-risk.
A redesign changes everything at once, so if conversion drops you can’t tell why, and you may throw away elements that were converting fine. Your current site, even if it looks dated, contains things that work: a layout shoppers understand, a checkout they’re used to, trust signals in familiar places. A rebuild can quietly remove those, and because everything moved together, you have no way to isolate the cause.
There’s a second cost that rarely makes the quote. A redesign resets your baseline. The behavioral data and testing history you’ve built up stop being comparable, so you start the next round of decisions with no evidence, having just spent the budget that would have funded it.
Redesign is genuinely right when the site is broken at the code level, unmaintainable, on a platform you’ve outgrown, or dated in ways that actively damage trust rather than just boring the team. Even then, run the optimization first and carry what you learn into the rebuild, so the new site is built on evidence and keeps what was already converting. Full comparison in redesign vs CRO.
We start with the audit, fix the biggest leak first, and prove every gain.
Our conversion optimization process is baseline-first: confirm your tracking is trustworthy, map your funnel, watch how real shoppers behave, pinpoint where revenue leaks, then test the highest-impact fix. We’d rather ship one change that measurably moves revenue than a dozen that look busy.
On one engagement, that approach lifted a client’s conversion rate by 6% and revenue per visitor by 7%, both A/B tested at 95% confidence.
Frequently asked questions
How do I improve my Shopify conversion rate?
Diagnose where visitors drop, then fix the biggest leak first, usually checkout or mobile. Show costs early, offer guest checkout, speed up the site, strengthen product pages. Measure each change.
What is a good Shopify conversion rate?
About 1.4% average; 3.2%+ is good (top 20%), 4.7%+ excellent (top 10%), per Littledata. It also depends on your industry and price point.
Is CRO better than buying more ads?
For most stores with traffic, yes, CRO lowers the cost of every customer and compounds on all traffic at once. The exception is stores with too little traffic to test.
Is CRO a one-time project or ongoing work?
Both. The first audit and fix round is a project. Testing and refinement afterward is ongoing, since traffic mix, devices, and customer behavior all shift over time.
Do I need a developer to do CRO?
For diagnosis, no, GA4 and Microsoft Clarity are free. For implementing many fixes and reliable A/B testing, a developer and proper tooling help.
Keep reading
Sources
Littledata, Average Ecommerce Conversion Rate (Shopify benchmark, 2,800 sites, 2023 data): 1.4% average, reported as a mean rather than a median; top 20% >3.2%, top 10% >4.7%; mobile 1.2%, desktop 1.9%; food and beverage ~1.5% average with top 10% above 6.2% — littledata.io
Baymard Institute, checkout abandonment reasons (excl. browsing): extra costs 40%, slow delivery 20%, card distrust 19%, forced account 18%, long or complicated checkout 17% — baymard.com. Baymard revises this page periodically and a later revision reports slightly different splits (39%, 21%, 19%, 19%, 18%), so re-check the live page and record the date you verified it.
Google, Core Web Vitals thresholds, each assessed at the 75th percentile of real page views — web.dev
Fracto client engagement: +6% conversion rate, +7% revenue per visitor, A/B tested at 95% confidence. Client remains anonymous.