CRO / Revenue
How to Increase Average Order Value on Shopify
// grow revenue without buying a single new visitor

By Fracto Solutions
September 11, 2026
The short answer
To increase average order value on Shopify, get each customer to spend more per order using a few proven levers: a free shipping threshold set above your current AOV, product bundles, and relevant upsells and cross-sells. AOV is total revenue divided by orders, so raising it grows revenue from the traffic you already have, no extra ad spend required.
3
levers: free shipping threshold, bundles, upsells
+7%
revenue per visitor lift on one Fracto engagement
$0
extra ad spend, AOV grows from existing traffic
What is average order value, and why does it matter?
Average order value (AOV) is your total revenue divided by your total number of orders over a period. It matters because raising it increases revenue from the traffic you already have, which is far cheaper than acquiring more.
The formula is simple: AOV equals total revenue divided by number of orders (use net revenue and completed orders, excluding refunds, for an accurate figure). A store with $300,000 in revenue across 2,500 orders has a $120 AOV.
Why it matters is the leverage:
every dollar of AOV increase flows across all your orders at once, and it costs nothing in acquisition.
Because your customer acquisition cost stays the same while each customer is worth more, raising AOV also improves your unit economics, the same reason CRO lowers CAC. It’s one of the three ways to grow revenue (more traffic, higher conversion, or higher AOV), and usually the most overlooked.
In fact revenue per visitor is the number that unites two of them: it equals conversion rate multiplied by AOV, so a store can grow revenue per visitor either by converting more shoppers or by growing each order.
That framing matters because it stops AOV work from being judged in isolation. A bundle that lifts AOV but quietly drops conversion may leave revenue per visitor flat, which is why the sections below keep returning to net revenue as the real measure rather than the AOV headline on its own.
Average order value (AOV) is your total revenue divided by your total number of orders over a period. It matters because raising it increases revenue from the traffic you already have, which is far cheaper than acquiring more.
The formula is simple: AOV equals total revenue divided by number of orders (use net revenue and completed orders, excluding refunds, for an accurate figure). A store with $300,000 in revenue across 2,500 orders has a $120 AOV.
Why it matters is the leverage: every dollar of AOV increase flows across all your orders at once, and it costs nothing in acquisition. Because your customer acquisition cost stays the same while each customer is worth more, raising AOV also improves your unit economics, the same reason CRO lowers CAC.
It’s one of the three ways to grow revenue (more traffic, higher conversion, or higher AOV), and usually the most overlooked. In fact revenue per visitor is the number that unites two of them: it equals conversion rate multiplied by AOV, so a store can grow revenue per visitor either by converting more shoppers or by growing each order.
That framing matters because it stops AOV work from being judged in isolation. A bundle that lifts AOV but quietly drops conversion may leave revenue per visitor flat, which is why the sections below keep returning to net revenue as the real measure rather than the AOV headline on its own.
Average order value (AOV) is your total revenue divided by your total number of orders over a period. It matters because raising it increases revenue from the traffic you already have, which is far cheaper than acquiring more.
The formula is simple: AOV equals total revenue divided by number of orders (use net revenue and completed orders, excluding refunds, for an accurate figure). A store with $300,000 in revenue across 2,500 orders has a $120 AOV.
Why it matters is the leverage: every dollar of AOV increase flows across all your orders at once, and it costs nothing in acquisition. Because your customer acquisition cost stays the same while each customer is worth more, raising AOV also improves your unit economics, the same reason CRO lowers CAC.
It’s one of the three ways to grow revenue (more traffic, higher conversion, or higher AOV), and usually the most overlooked. In fact revenue per visitor is the number that unites two of them: it equals conversion rate multiplied by AOV, so a store can grow revenue per visitor either by converting more shoppers or by growing each order.
That framing matters because it stops AOV work from being judged in isolation. A bundle that lifts AOV but quietly drops conversion may leave revenue per visitor flat, which is why the sections below keep returning to net revenue as the real measure rather than the AOV headline on its own.
An honest note on AOV "uplift" numbers
Before the tactics, a caveat: the specific uplift percentages quoted for AOV tactics vary enormously between sources and rarely trace to a primary study. Treat them as directional, and measure your own.
You’ll see claims that free shipping thresholds lift AOV “12 to 18%”, or “15 to 30%”, or bundles “15 to 25%”, and upsells “10 to 30%.”
The honest truth is these ranges disagree because they come from different stores, different implementations, and mostly from vendor blogs, not controlled studies.
So this guide won’t hand you a fake-precise number. What’s reliable is the *direction* (these levers do raise AOV when set up well) and the *arithmetic* (you can calculate the right threshold and the net margin effect exactly).
The only number that matters is the one you measure on your own store, which is why every lever below should be A/B tested with AOV, and net revenue, as the metric.
How does a free shipping threshold increase AOV?
By giving shoppers a reason to add one more item. When free shipping kicks in above a set order value, customers near that line often add products to qualify, raising the average order. It’s widely considered the single most effective AOV lever.
Free shipping is one of the biggest drivers of where people shop, and unexpected extra costs are the number-one reason shoppers abandon checkout, cited by 40% of abandoners in Baymard’s research, once you set aside the larger group who were only browsing.
A threshold turns that into an opportunity: instead of absorbing shipping on every order, you offer it above a target, and shoppers close to the line add items to reach it.
The mechanism is the goal-gradient effect, people push harder as they near a goal, which is why a dynamic progress cue (“you’re $12 away from free shipping”) outperforms a static “free shipping over $85.”
The setup math is in the next section, and the full deep-dive is in do free shipping thresholds actually work.
Where should I set my free shipping threshold?
Set it above your current AOV, commonly 15 to 30 percent above, so the gap feels achievable, not like a second order. Too high and shoppers give up and pay for shipping (or abandon); too low and you give away shipping you’d have gotten anyway.
The rule of thumb, consistent across sources, is to anchor the threshold to your existing AOV rather than a round number. If your AOV is $65, a threshold around $75 to $85 nudges shoppers to add one item; a $150 threshold feels like starting over and backfires. Here’s the trade-off in a simple table:
Threshold vs your AOV
Likely effect
Below AOV
Gives away shipping on orders you'd win anyway
15 to 30% above AOV
The sweet spot: achievable, nudges one more item
Far above AOV (e.g. 2x+)
Feels unreachable; shoppers give up or abandon
*Guidance compiled from multiple 2026 AOV/free-shipping analyses; the exact sweet spot varies, so test 2 to 3 thresholds with AOV and net revenue as the metric.*
Crucially, check the margin: a threshold that raises AOV but costs more in absorbed shipping than it earns is set wrong. The net-benefit math (added revenue minus added shipping cost) is what tells you if it’s working, not the AOV number alone.
Do bundles and upsells actually raise AOV?
Yes, when they’re relevant. Bundling complementary products and offering well-matched upsells or cross-sells both raise the average order, because they make it easy for a shopper to buy more of what they already want.
Three related levers:
Bundles. Group complementary products at a slight saving versus buying separately. This raises AOV and can move slow inventory, and it works because it removes the effort of finding matching items.
Cross-sells. Suggest genuinely relevant additions (“goes well with”) on the product page or in the cart. Relevance is everything, a random suggestion is ignored; a matched one converts.
Upsells. Offer a better or larger version of what they’re buying. Post-purchase upsells (after checkout, before confirmation) are especially low-risk because they don’t disrupt the original purchase.
Gift-with-purchase and volume incentives. A free gift above a spend level, or a “buy two, save 10%” offer in replenishment categories, gives shoppers a concrete reason to add one more unit. Like the others, these only pay off if the added margin clears the added cost, so they belong in the same net-revenue test as everything else.
The common failure is irrelevance: bolt-on “you may also like” widgets showing unrelated products do little. The stores that win at this suggest things a shopper would plausibly want, drawn from their own data on what actually sells together, which is a merchandising and data problem, not a widget problem, and often a light development lift to implement cleanly. We compare the two main approaches in upselling vs cross-selling: what works.
- The AOV levers
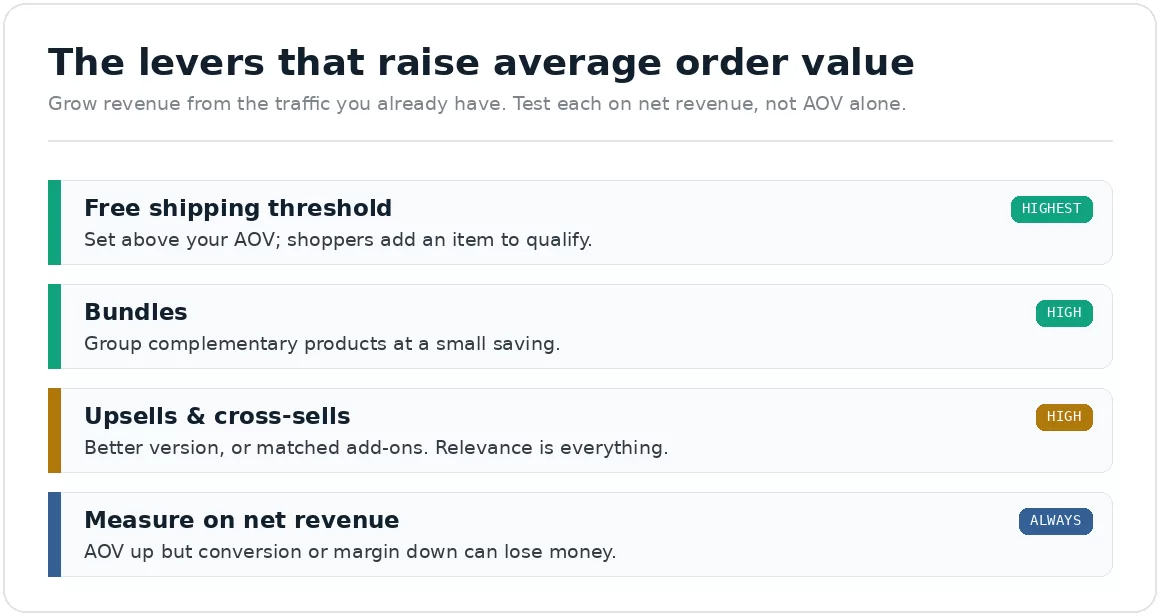
Grow revenue from the traffic you already have. Test each on net revenue, not AOV alone.
How do I measure whether an AOV tactic is working?
Track AOV and net revenue together, not AOV alone. A tactic that raises AOV but drops conversion or eats margin can lose money, so the real test is whether total net revenue went up.
This is the discipline that separates real AOV work from vanity. Any tactic can raise the headline AOV number, refuse small orders and your AOV “improves”, but that’s not the goal.
What you want is more total profit. So measure three things when you test a lever: AOV (did orders get bigger?), conversion rate (did the tactic scare anyone off?), and margin (did absorbed shipping or discounts eat the gain?).
Net revenue, and ideally contribution margin, is the scoreboard. This is exactly the kind of change worth running through a proper A/B test, with AOV and net revenue as the primary metrics.
We treat AOV as a revenue lever to test, not a number to inflate.
We move event tracking onto the Web Pixels API (official apps where they exist, custom pixels where they don’t), route any GTM needs through a custom pixel, and add server-side tracking for accuracy. Then we place test orders to confirm every event fires once, with the right data.
It’s the same baseline-first discipline behind our conversion optimization work: get the tracking right first, because a broken checkout event quietly corrupts every report you rely on.
Frequently asked questions
How do I calculate average order value?
AOV equals total revenue divided by the number of orders over a period. Use net revenue and completed orders, and exclude refunded or cancelled orders so the figure stays accurate and comparable. For example, $300,000 in net revenue across 2,500 orders is a $120 AOV.
What's the fastest way to increase AOV on Shopify?
For most stores, a free shipping threshold set 15 to 30 percent above current AOV, because it’s easy to implement and directly nudges shoppers to add an item. Pair it with a progress cue (“you’re $X away”). Then layer in relevant bundles and cross-sells.
Where should I set my free shipping threshold?
Above your current AOV, commonly 15 to 30 percent above, so the gap is achievable. Too high and shoppers abandon or pay for shipping; too low and you give away shipping unnecessarily. Test two or three thresholds and judge by net revenue, not AOV alone.
Do upsells and cross-sells really work?
Yes, when they’re relevant. Well-matched suggestions (“goes with this”) and better-version upsells raise AOV; random “you may also like” widgets rarely do. Relevance and placement (product page, cart, post-purchase) matter more than the tactic label.
How much will these tactics increase my AOV?
Honestly, it varies too much to promise a number, published uplift figures range widely and depend on your store, products, and execution. Treat any quoted percentage as directional, implement the lever well, and measure your own AOV and net revenue to see the real effect.
Keep reading
Sources
AOV formula (revenue ÷ orders, net of refunds) and free-shipping threshold rule of thumb (set 15 to 30% above current AOV): consistent across multiple 2026 AOV analyses.
https://www.clickpost.ai/blog/average-order-value-by-industry ; https://ecomhint.com/blog/average-order-value-by-industry
Free shipping is a leading driver of shopping choice. Unexpected extra costs are the number-one checkout abandonment reason at 40%, once respondents who were only browsing are excluded; browsing is the largest group overall.
Baymard revises this page periodically and a later revision reports 39%, so re-check and record the date you verified it. Baymard Institute. https://baymard.com/lists/cart-abandonment-rate
AOV uplift percentages for thresholds, bundles, and upsells vary widely by source and are treated as directional here, not cited as precise figures. (Multiple 2026 vendor analyses, ranges disagree.)
CRO / Revenue
How to Increase Average Order Value on Shopify
// grow revenue without buying a single new visitor
By Fracto Solutions
September 11, 2026
The short answer
To increase average order value on Shopify, get each customer to spend more per order using a few proven levers: a free shipping threshold set above your current AOV, product bundles, and relevant upsells and cross-sells. AOV is total revenue divided by orders, so raising it grows revenue from the traffic you already have, no extra ad spend required.
3
levers: free shipping threshold, bundles, upsells
+7%
revenue per visitor lift on one Fracto engagement
$0
extra ad spend, AOV grows from existing traffic
What is average order value, and why does it matter?
Average order value (AOV) is your total revenue divided by your total number of orders over a period. It matters because raising it increases revenue from the traffic you already have, which is far cheaper than acquiring more.
The formula is simple: AOV equals total revenue divided by number of orders (use net revenue and completed orders, excluding refunds, for an accurate figure). A store with $300,000 in revenue across 2,500 orders has a $120 AOV.
Why it matters is the leverage:
every dollar of AOV increase flows across all your orders at once, and it costs nothing in acquisition.
Because your customer acquisition cost stays the same while each customer is worth more, raising AOV also improves your unit economics, the same reason CRO lowers CAC. It’s one of the three ways to grow revenue (more traffic, higher conversion, or higher AOV), and usually the most overlooked.
In fact revenue per visitor is the number that unites two of them: it equals conversion rate multiplied by AOV, so a store can grow revenue per visitor either by converting more shoppers or by growing each order.
That framing matters because it stops AOV work from being judged in isolation. A bundle that lifts AOV but quietly drops conversion may leave revenue per visitor flat, which is why the sections below keep returning to net revenue as the real measure rather than the AOV headline on its own.
Average order value (AOV) is your total revenue divided by your total number of orders over a period. It matters because raising it increases revenue from the traffic you already have, which is far cheaper than acquiring more.
The formula is simple: AOV equals total revenue divided by number of orders (use net revenue and completed orders, excluding refunds, for an accurate figure). A store with $300,000 in revenue across 2,500 orders has a $120 AOV.
Why it matters is the leverage:
every dollar of AOV increase flows across all your orders at once, and it costs nothing in acquisition. Because your customer acquisition cost stays the same while each customer is worth more, raising AOV also improves your unit economics, the same reason CRO lowers CAC.
It’s one of the three ways to grow revenue (more traffic, higher conversion, or higher AOV), and usually the most overlooked. In fact revenue per visitor is the number that unites two of them: it equals conversion rate multiplied by AOV, so a store can grow revenue per visitor either by converting more shoppers or by growing each order.
That framing matters because it stops AOV work from being judged in isolation. A bundle that lifts AOV but quietly drops conversion may leave revenue per visitor flat, which is why the sections below keep returning to net revenue as the real measure rather than the AOV headline on its own.
Average order value (AOV) is your total revenue divided by your total number of orders over a period. It matters because raising it increases revenue from the traffic you already have, which is far cheaper than acquiring more.
The formula is simple: AOV equals total revenue divided by number of orders (use net revenue and completed orders, excluding refunds, for an accurate figure).
A store with $300,000 in revenue across 2,500 orders has a $120 AOV.
Why it matters is the leverage:
every dollar of AOV increase flows across all your orders at once, and it costs nothing in acquisition.
Because your customer acquisition cost stays the same while each customer is worth more, raising AOV also improves your unit economics, the same reason CRO lowers CAC. It’s one of the three ways to grow revenue (more traffic, higher conversion, or higher AOV), and usually the most overlooked.
In fact revenue per visitor is the number that unites two of them: it equals conversion rate multiplied by AOV, so a store can grow revenue per visitor either by converting more shoppers or by growing each order.
That framing matters because it stops AOV work from being judged in isolation. A bundle that lifts AOV but quietly drops conversion may leave revenue per visitor flat, which is why the sections below keep returning to net revenue as the real measure rather than the AOV headline on its own.
An honest note on AOV "uplift" numbers
Before the tactics, a caveat: the specific uplift percentages quoted for AOV tactics vary enormously between sources and rarely trace to a primary study. Treat them as directional, and measure your own.
You’ll see claims that free shipping thresholds lift AOV “12 to 18%”, or “15 to 30%”, or bundles “15 to 25%”, and upsells “10 to 30%.”
The honest truth is these ranges disagree because they come from different stores, different implementations, and mostly from vendor blogs, not controlled studies.
So this guide won’t hand you a fake-precise number. What’s reliable is the *direction* (these levers do raise AOV when set up well) and the *arithmetic* (you can calculate the right threshold and the net margin effect exactly).
The only number that matters is the one you measure on your own store, which is why every lever below should be A/B tested with AOV, and net revenue, as the metric.
How does a free shipping threshold increase AOV?
By giving shoppers a reason to add one more item. When free shipping kicks in above a set order value, customers near that line often add products to qualify, raising the average order. It’s widely considered the single most effective AOV lever.
Free shipping is one of the biggest drivers of where people shop, and unexpected extra costs are the number-one reason shoppers abandon checkout, cited by 40% of abandoners in Baymard’s research, once you set aside the larger group who were only browsing.
A threshold turns that into an opportunity: instead of absorbing shipping on every order, you offer it above a target, and shoppers close to the line add items to reach it.
The mechanism is the goal-gradient effect, people push harder as they near a goal, which is why a dynamic progress cue (“you’re $12 away from free shipping”) outperforms a static “free shipping over $85.”
The setup math is in the next section, and the full deep-dive is in do free shipping thresholds actually work.
Where should I set my free shipping threshold?
Set it above your current AOV, commonly 15 to 30 percent above, so the gap feels achievable, not like a second order. Too high and shoppers give up and pay for shipping (or abandon); too low and you give away shipping you’d have gotten anyway.
The rule of thumb, consistent across sources, is to anchor the threshold to your existing AOV rather than a round number. If your AOV is $65, a threshold around $75 to $85 nudges shoppers to add one item; a $150 threshold feels like starting over and backfires. Here’s the trade-off in a simple table:
Threshold vs your AOV
Likely effect
Below AOV
Gives away shipping on orders you'd win anyway
15 to 30% above AOV
The sweet spot: achievable, nudges one more item
Far above AOV (e.g. 2x+)
Feels unreachable; shoppers give up or abandon
*Guidance compiled from multiple 2026 AOV/free-shipping analyses; the exact sweet spot varies, so test 2 to 3 thresholds with AOV and net revenue as the metric.*
Crucially, check the margin: a threshold that raises AOV but costs more in absorbed shipping than it earns is set wrong. The net-benefit math (added revenue minus added shipping cost) is what tells you if it’s working, not the AOV number alone.
Do bundles and upsells actually raise AOV?
Yes, when they’re relevant. Bundling complementary products and offering well-matched upsells or cross-sells both raise the average order, because they make it easy for a shopper to buy more of what they already want.
Three related levers:
Bundles. Group complementary products at a slight saving versus buying separately. This raises AOV and can move slow inventory, and it works because it removes the effort of finding matching items.
Cross-sells. Suggest genuinely relevant additions (“goes well with”) on the product page or in the cart. Relevance is everything, a random suggestion is ignored; a matched one converts.
Upsells. Offer a better or larger version of what they’re buying. Post-purchase upsells (after checkout, before confirmation) are especially low-risk because they don’t disrupt the original purchase.
Gift-with-purchase and volume incentives. A free gift above a spend level, or a “buy two, save 10%” offer in replenishment categories, gives shoppers a concrete reason to add one more unit. Like the others, these only pay off if the added margin clears the added cost, so they belong in the same net-revenue test as everything else.
The common failure is irrelevance: bolt-on “you may also like” widgets showing unrelated products do little. The stores that win at this suggest things a shopper would plausibly want, drawn from their own data on what actually sells together, which is a merchandising and data problem, not a widget problem, and often a light development lift to implement cleanly. We compare the two main approaches in upselling vs cross-selling: what works.
- The AOV levers
Grow revenue from the traffic you already have. Test each on net revenue, not AOV alone.
How do I measure whether an AOV tactic is working?
Track AOV and net revenue together, not AOV alone. A tactic that raises AOV but drops conversion or eats margin can lose money, so the real test is whether total net revenue went up.
This is the discipline that separates real AOV work from vanity. Any tactic can raise the headline AOV number, refuse small orders and your AOV “improves”, but that’s not the goal.
What you want is more total profit. So measure three things when you test a lever: AOV (did orders get bigger?), conversion rate (did the tactic scare anyone off?), and margin (did absorbed shipping or discounts eat the gain?).
Net revenue, and ideally contribution margin, is the scoreboard. This is exactly the kind of change worth running through a proper A/B test, with AOV and net revenue as the primary metrics.
We treat AOV as a revenue lever to test, not a number to inflate.
We move event tracking onto the Web Pixels API (official apps where they exist, custom pixels where they don’t), route any GTM needs through a custom pixel, and add server-side tracking for accuracy. Then we place test orders to confirm every event fires once, with the right data.
It’s the same baseline-first discipline behind our conversion optimization work: get the tracking right first, because a broken checkout event quietly corrupts every report you rely on.
Frequently asked questions
How do I calculate average order value?
AOV equals total revenue divided by the number of orders over a period. Use net revenue and completed orders, and exclude refunded or cancelled orders so the figure stays accurate and comparable. For example, $300,000 in net revenue across 2,500 orders is a $120 AOV.
What's the fastest way to increase AOV on Shopify?
For most stores, a free shipping threshold set 15 to 30 percent above current AOV, because it’s easy to implement and directly nudges shoppers to add an item. Pair it with a progress cue (“you’re $X away”). Then layer in relevant bundles and cross-sells.
Where should I set my free shipping threshold?
Above your current AOV, commonly 15 to 30 percent above, so the gap is achievable. Too high and shoppers abandon or pay for shipping; too low and you give away shipping unnecessarily. Test two or three thresholds and judge by net revenue, not AOV alone.
Do upsells and cross-sells really work?
Yes, when they’re relevant. Well-matched suggestions (“goes with this”) and better-version upsells raise AOV; random “you may also like” widgets rarely do. Relevance and placement (product page, cart, post-purchase) matter more than the tactic label.
How much will these tactics increase my AOV?
Honestly, it varies too much to promise a number, published uplift figures range widely and depend on your store, products, and execution. Treat any quoted percentage as directional, implement the lever well, and measure your own AOV and net revenue to see the real effect.
Keep reading
Sources
AOV formula (revenue ÷ orders, net of refunds) and free-shipping threshold rule of thumb (set 15 to 30% above current AOV): consistent across multiple 2026 AOV analyses.
https://www.clickpost.ai/blog/average-order-value-by-industry ; https://ecomhint.com/blog/average-order-value-by-industry
Free shipping is a leading driver of shopping choice. Unexpected extra costs are the number-one checkout abandonment reason at 40%, once respondents who were only browsing are excluded; browsing is the largest group overall.
Baymard revises this page periodically and a later revision reports 39%, so re-check and record the date you verified it. Baymard Institute. https://baymard.com/lists/cart-abandonment-rate
AOV uplift percentages for thresholds, bundles, and upsells vary widely by source and are treated as directional here, not cited as precise figures. (Multiple 2026 vendor analyses, ranges disagree.)