Email / Benchmarks
Ecommerce Email Marketing Benchmarks: What to Actually Track
// open rates lie; click, revenue, and deliverability tell the truth

By Fracto Solutions
September 30, 2026
The short answer
Ecommerce email benchmarks are directional, not targets. Open rates (commonly cited around 31 to 40 percent) are inflated by Apple Mail Privacy Protection, so trust click rate (roughly 1.7 percent for campaigns, 5 percent-plus for flows) and revenue per recipient instead. Flows massively outperform campaigns, and deliverability gates all of it. Benchmark against your own trend, not a published average.
~41%
MPP
85-90%
Why are most email benchmarks misleading?
Because open rate, the headline metric, is inflated by Apple Mail Privacy Protection, which auto-loads tracking pixels and registers “opens” that never happened. Published averages also mix wildly different senders, so a single number tells you little about your own performance.
Two problems make benchmark reports less useful than they look. First, Apple Mail Privacy Protection (MPP): since Apple started pre-loading email images for its users, a large share of “opens” are automated, not human, which inflates open rates and makes them unreliable as a measure of real engagement. That’s why reported averages range so widely (roughly 31 percent from Klaviyo’s ecommerce data up to 40 percent-plus elsewhere), they’re measuring different samples with different MPP effects. Second, averages blend everyone: a store sending daily discount blasts and one sending careful segmented flows land in the same “average,” which describes neither. The takeaway isn’t to ignore benchmarks entirely, it’s to use them as rough context and focus on the metrics MPP can’t fake: clicks, conversions, and revenue.
What email metrics should I actually track?
Track click rate, conversion (placed-order) rate, revenue per recipient, and deliverability, not open rate as your primary signal. These reflect real engagement and revenue, and they can’t be inflated by automated opens the way open rate can.
Here’s what to focus on, with directional 2026 figures (treat as context, benchmark against your own trend):
Metric
Directional benchmark
Why it matters
Open rate
~31 to 40% (inflated by Apple MPP)
Weak signal now; use only for rough subject-line direction
Campaign click rate
~1.7% (top brands ~3.4%)
Real engagement; MPP can't fake it
Flow click rate
~5.5%+ (top ~10%+)
Flows massively outperform campaigns
Placed-order rate
~0.16% campaigns, ~2% flows
Actual conversions from email
Revenue per recipient
varies widely by flow/segment
The bottom-line measure of email value
Deliverability / inbox placement
aim for 85 to 90%+
Gates everything else
Directional figures compiled across 2026 email benchmark sources; campaign click/open/order figures trace to Klaviyo’s 2026 report (183,000+ brands). Exact numbers vary by source and sample; benchmark against your own trend.
Notice open rate is demoted, not deleted. It still hints at subject-line and deliverability health, but click, conversion, revenue, and deliverability are the numbers that actually tell you how email is performing.
Why do flows outperform campaigns so much?
Because flows (automated, triggered emails like welcome and cart recovery) reach people at moments of high intent, while campaigns blast everyone regardless of where they are. Flows generate a hugely disproportionate share of email revenue from a tiny share of sends.
This is the single most important pattern in ecommerce email, and it’s consistent across every source. Flows, the automated sequences triggered by behavior (someone joins your list, abandons a cart, makes a purchase), reach the right person at the right moment, so they convert far better than broadcast campaigns. Klaviyo’s 2026 data shows flows generating roughly 41 percent of email revenue from only about 5 percent of sends, with flow click rates around 3.3 times higher than campaigns. The implication for strategy is clear: your automated flows are where the revenue-per-send is, so building and optimizing them (welcome, cart, browse, post-purchase, win-back) matters far more than sending more campaigns. The flow playbook itself is in email and lifecycle marketing for DTC brands; this pillar is about measuring and improving what you’ve built.
- Flows vs campaigns
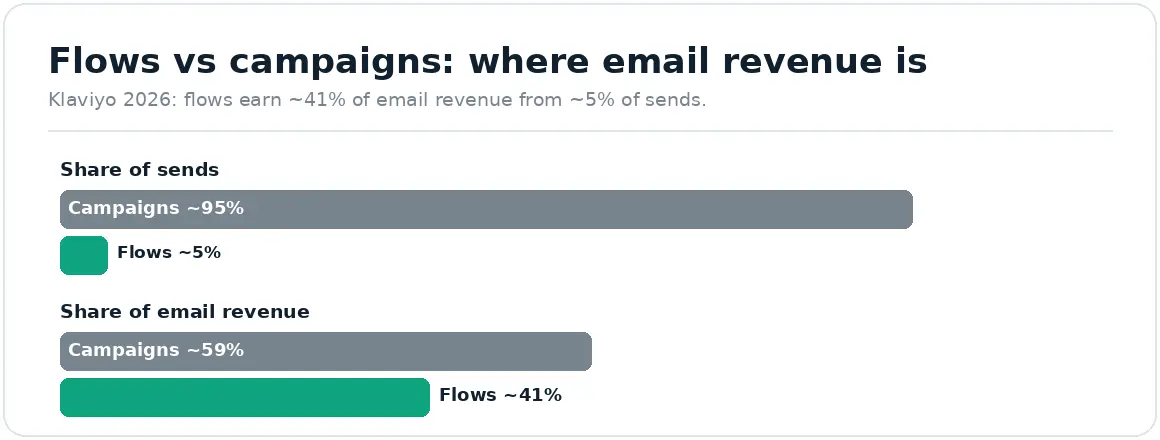
Klaviyo 2026: flows earn most of the revenue-per-send. Build and optimize them.
Why does deliverability gate everything?
Because an email that lands in spam or the Promotions tab can’t be opened, clicked, or converted, no matter how good it is. If a chunk of your emails never reach the inbox, your real performance is lower than your dashboard shows, and no amount of better content fixes it.
Deliverability is the foundation under every other email metric, and the most overlooked. You can have perfect subject lines, beautiful design, and tight segmentation, but if 15 percent of your emails land in spam, your effective performance is 15 percent lower than reported, and you may never know. The practical thresholds, consistent across sources: aim for inbox placement of 85 to 90 percent or higher, keep bounce rates under about 0.5 percent, spam complaints under roughly 0.1 percent, and unsubscribes under about 0.3 percent per campaign. When these slip, deliverability quietly caps your results. That’s why it’s the first thing to check when email performance drops, before touching content, covered fully in email deliverability best practices.
How does segmentation change these numbers?
Dramatically. Sending relevant emails to targeted segments produces far higher engagement and revenue per recipient than blasting your whole list, and it protects deliverability by keeping unengaged people out of your sends. Better segmentation lifts almost every metric at once.
Segmentation is the lever that moves your numbers away from the “average” and toward the top performers. When you send based on who someone is and what they’ve done (engaged buyers, lapsed customers, category interest) rather than blasting everyone, click and conversion rates rise because the message is relevant, and revenue per recipient climbs because you’re reaching people likely to buy. Segmentation also protects deliverability: excluding chronically unengaged subscribers from routine sends keeps your engagement rates high, which mailbox providers reward with better inbox placement. So segmentation improves the content metrics and the deliverability metrics together, it’s the highest-leverage discipline in email after having good flows. The how-to is in Klaviyo segmentation strategy.
What should I do if my numbers are below benchmark?
Diagnose in order: check deliverability first (are emails reaching the inbox?), then segmentation (are you sending relevant emails to the right people?), then content (subject lines, offers, design). Fix the biggest revenue gap first, and re-benchmark against yourself in about 90 days.
Rather than panicking at a below-average number, work through the causes in the order that matters:
Low opens? First suspect deliverability and list hygiene (and remember MPP makes opens unreliable anyway). Check inbox placement before blaming subject lines.
Low clicks? Usually content and relevance, better segmentation, offers, and design.
Low revenue per recipient? Tighter segmentation and better landing pages and product pages (the conversion side).
Below on everything? Deliverability is the likely root; fix that first.
Then re-measure against your own trend after about 90 days, because your improvement over time matters far more than how you compare to a blended industry average. This mirrors the metric discipline in ecommerce KPIs that actually matter: track the numbers that drive decisions, against yourself.
How often should I benchmark my email program?
Review your core metrics (click rate, conversion, revenue per recipient, and deliverability) monthly against your own trend, and do a fuller comparison against industry ranges quarterly. Frequent enough to catch problems early, not so often that normal week-to-week noise looks like a trend.
The right cadence keeps you responsive without overreacting. Month to month, watch the metrics that matter (clicks, conversions, revenue per recipient, and the deliverability signals) on your own trend line, that’s where you spot a real decline early, like deliverability slipping or a flow losing steam. Quarterly, step back and compare against industry ranges for a rough sanity check, and re-benchmark after any significant change (a new flow, a list-hygiene pass, a deliverability fix) to confirm it worked. Throughout, remember the honest framing of this whole guide: your improvement over your own past performance matters far more than how you stack up against a blended average built from thousands of unlike senders. Chasing someone else’s number is how stores end up optimizing opens; tracking your own trend on the metrics that drive revenue is how they actually grow email.
We optimize the metrics that reflect real revenue, not the vanity of open rate.
Rather than chasing published benchmarks, we make sure your emails actually reach the inbox, tighten segmentation so the right people get the right message, and prioritize the flows that produce most of email’s revenue. Then we measure against your own trend, because a rising revenue-per-recipient on your list matters more than beating a blended average.
It’s the same measurement-first discipline behind our email and lifecycle work and our conversion optimization, where rebuilding a client’s buying path lifted conversion 6% and revenue per visitor 7%, both measured at 95% confidence, because email that reaches the inbox still needs a page that converts.
// we would rather show up in your reporting than in your inbox
Frequently asked questions
What is a good email open rate for ecommerce in 2026?
Reported averages range widely, roughly 31 percent (Klaviyo’s ecommerce data) up to 40 percent-plus elsewhere, but open rate is inflated by Apple Mail Privacy Protection and is now a weak signal. Focus instead on click rate (about 1.7 percent for campaigns, 5 percent-plus for flows) and revenue per recipient.
What email metrics actually matter?
Click rate, placed-order (conversion) rate, revenue per recipient, and deliverability, not open rate as your primary measure. These reflect real engagement and revenue and can’t be inflated by the automated opens that Apple MPP generates. Benchmark them against your own trend, not a blended industry average.
Why do email flows perform better than campaigns?
Because flows are automated and triggered by behavior (joining the list, abandoning a cart, buying), so they reach people at high-intent moments, while campaigns blast everyone. Klaviyo’s 2026 data shows flows generating around 41 percent of email revenue from just 5 percent of sends, with far higher click rates.
What deliverability numbers should I watch?
Aim for inbox placement of 85 to 90 percent or higher, bounce rate under about 0.5 percent, spam complaints under roughly 0.1 percent, and unsubscribes under about 0.3 percent per campaign. If these slip, deliverability caps every other metric, so check it first when performance drops.
My email metrics are below benchmark, what should I do?
Diagnose in order: deliverability first (are emails reaching the inbox?), then segmentation (are you sending relevant emails to the right people?), then content. Fix the biggest revenue gap first and re-benchmark against your own numbers in about 90 days, rather than chasing a blended average.
Sources
Every statistic is traced to its original publisher and dated. Email benchmark figures are directional and vary by source and sample; open rate is inflated by Apple Mail Privacy Protection, so this page relies on click, conversion, revenue, and deliverability rather than opens. Benchmark against your own trend.
Klaviyo 2026 Benchmark Report (183,000+ brands): campaign average ~31% open, ~1.69% click, ~0.16% placed-order rate; flow click ~5.58% (~3.3x campaigns); flows ~41% of email revenue from ~5.3% of sends. Cited consistently across 2026 sources. https://konabayev.com/blog/email-marketing-benchmarks-2026/ ; https://christopholivierconsulting.com/email-marketing-benchmarks/ ; https://www.threadpoint.agency/blogs/learn-e-mail-marketing/whats-a-good-email-open-rate-for-ecommerce-2026-benchmarks
Open rate inflated by Apple Mail Privacy Protection; reported averages vary by source (31% to 42%) due to sample and MPP differences, so treat as directional. https://www.clickminded.com/email-marketing-benchmarks/
Deliverability thresholds (inbox placement 85 to 90%+, bounce <0.5%, complaints <0.1%, unsub <0.3%): https://retentionside.com/blog/ecommerce-email-marketing-benchmarks ; https://www.goshdigital.co/blog/klaviyo-benchmarks-by-industry
Fracto client engagement: +6% conversion rate, +7% revenue per visitor, measured at 95% confidence.