CRO / Testing
How to Run A/B Tests on an Ecommerce Store
// test the change, don't guess the change

By Fracto Solutions
September 10, 2026
The short answer
To run an A/B test on an ecommerce store, form a clear hypothesis, split traffic between the original and a variant, and measure which converts better, but only trust the result once it reaches 95% statistical significance and your pre-calculated sample size. Most stores lack the traffic for tiny tweaks, so test bold changes that can produce large, detectable lifts.
95%
confidence standard before you trust a winner
80%
standard statistical power for a valid test
~1 in 5
tests that win, a normal, healthy rate
What is A/B testing, and how does it work?
A/B testing shows two versions of a page to different visitors at the same time, the original (“control”) and a changed version (“variant”), then measures which one converts better. Whichever wins, backed by enough data, is the version you keep.
The “at the same time” part matters. Because both versions run simultaneously to randomly split traffic, external factors (a sale, a season, a viral post) hit both equally, so the difference you measure comes from the change itself, not from timing. That’s what makes A/B testing more trustworthy than “change it and see if sales go up”, which can’t separate your change from everything else happening that week. You test one clear change at a time, measure the effect on a single primary metric, and let the data decide.
Why should ecommerce stores A/B test at all?
Because it removes guesswork from decisions that cost real money. Instead of redesigning on opinion and hoping, you prove what actually moves revenue for your specific shoppers before rolling it out.
Opinions about what will convert are cheap and often wrong, what worked for another store, or what looks better to you, may do nothing (or harm) for your shoppers. A/B testing replaces that with evidence. It also protects you from your own good ideas: plenty of “obvious improvements” lose in testing, and finding that out on a fraction of traffic is far cheaper than rolling a loser out to everyone. The trade-off is that testing takes traffic and time, which is why it complements, rather than replaces, the diagnostic work in a CRO audit that our conversion optimization team runs to tell you what’s worth testing first.
How much traffic do I need to A/B test?
It depends on three things: your baseline conversion rate, the size of the improvement you want to detect, and your confidence and power settings. There is no single universal number, but smaller improvements need dramatically more traffic.
This is the question that stops most stores, and the honest answer is “it depends”, but in a way you can calculate. The smaller the lift you’re trying to detect, the more traffic you need, and the relationship is steep: halving the effect you want to detect roughly quadruples the sample size required. Here’s a practical reference at typical settings (95% significance, 80% power):
Baseline conversion rate
Relative lift to detect (MDE)
Visitors per variation
Total for an A/B test
1%
20%
~43,000
~86,000
2%
15%
~37,000
~74,000
2%
25%
~14,000
~28,000
3%
10%
~53,000
~106,000
5%
10%
~31,000
~62,000
5%
25%
~5,300
~10,600
5%
50%
~1,500
~3,000
Source: compiled from multiple 2026 A/B testing sample-size analyses. Figures are approximate and depend on exact inputs; always run your own calculation.
The takeaway isn’t the exact numbers, they shift with your inputs, it’s the pattern: low-traffic stores can’t reliably detect small changes, so they should test big, bold ones. There’s a full breakdown in how much traffic you need for a valid A/B test.
What is statistical significance, and why does 95% matter?
Statistical significance is the probability that your result reflects a real difference and not random chance. The ecommerce standard is 95% confidence, meaning a 5% chance the result is a fluke. Below that, you can’t trust the winner.
Think of it as a guard against being fooled by noise. Any two versions will show *some* difference just by randomness; significance tells you whether the difference is big and consistent enough to be real. At 95% confidence (a p-value of 0.05 or lower), there’s only a 1-in-20 chance you’re seeing a false positive. But, and this is the part most stores miss, reaching 95% is not enough on its own. You also have to hit your pre-calculated sample size. A test that hits 95% after only a few hundred visitors will often reverse itself with more data. Significance plus adequate sample size together are what make a result trustworthy.
One practical framing helps here: decide your MDE and sample size before launch, then treat the test as locked. The discipline of not looking until it’s done is what separates a trustworthy program from a stream of false positives, because with enough peeking almost any test will cross 95% by chance at some point. Pre-commit, then wait. If the required run time comes out longer than a couple of months, that’s a signal the test isn’t worth running at all as designed, and you should either pick a bolder change or a higher-traffic page.
How long should I run an A/B test?
Long enough to reach your required sample size and to cover full business cycles, usually at least one to two weeks, often two to four. Never stop the moment it looks like it’s winning.
Two rules govern test duration. First, sample size: run until you’ve collected the number of visitors your calculation called for, not until the result looks good. Second, business cycles: run for whole weeks so weekday-versus-weekend and other cyclical patterns are represented in both variants, a test that runs Monday to Thursday can be skewed by missing weekend behavior. In practice that means most ecommerce tests run two to four weeks. Stopping early because the variant is “clearly winning” is the single most common way stores fool themselves, early leads routinely evaporate.
What are the most common A/B testing mistakes?
The big ones: stopping too early, testing changes too small for your traffic, testing too many things at once, and ignoring sample size. Each produces results that look convincing but don’t hold up.
Peeking and stopping early. Checking constantly and stopping when it looks significant inflates false positives. Decide your sample size and duration up front, then wait.
Testing changes too small to detect. A button-color tweak needs enormous traffic to prove. If your store can’t reach the sample size, test bolder changes.
Changing multiple things at once. If you change the headline, image, and button together, a win tells you the bundle worked but not which part. Isolate changes when you can.
Ignoring sample size. Reaching 95% significance without hitting the pre-calculated sample is a classic false positive.
Judging on the wrong metric. Optimizing clicks when you care about revenue can produce “winners” that don’t lift sales. Use revenue per visitor where you can.
We cover these in depth in A/B testing mistakes that invalidate your results.
- The A/B testing loop
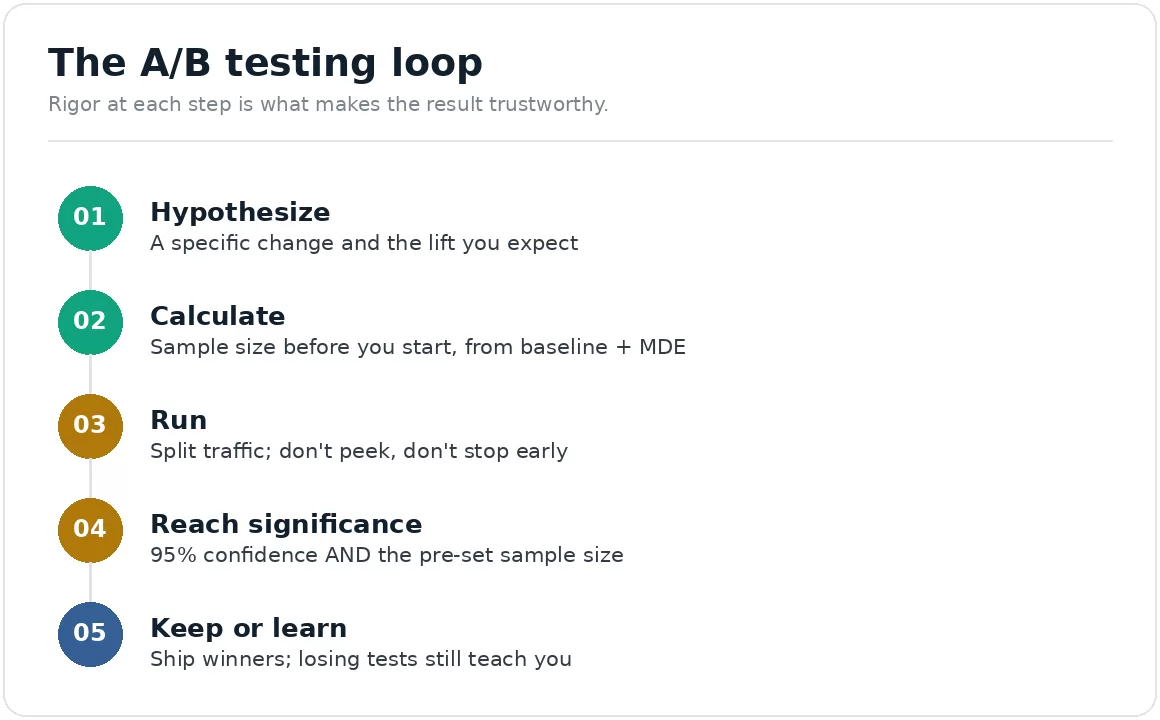
Rigor at each step is what makes the result trustworthy.
What should I test first?
Start where the money is and where the impact is biggest: usually checkout, product pages, and the mobile experience, guided by where your funnel actually leaks, not by a list of generic “best practices.”
The best first tests aren’t random, they target your store’s actual weak points. Diagnose where shoppers drop (analytics for where, session recordings for why), then test bold changes at that leak. For most stores the highest-impact areas are checkout friction, product-page clarity, and mobile usability, often needing development support to implement, because that’s where committed buyers are lost. Testing there, with changes big enough to detect, gives you the best odds of a real, measurable win. The prioritization method is in what to test first on a Shopify store.
We test bold changes at the biggest leak, and only call a winner when the statistics support it.
Our process is baseline-first: we diagnose where your funnel leaks, form a specific hypothesis, calculate the sample size before we start, and run the test to significance and full business cycles rather than stopping when it looks good. We judge results on revenue, not vanity metrics, and report the tests that lose as openly as the ones that win.
On one recent engagement, that discipline meant calculating the test before running it, so nobody ended up chasing a result the traffic could never have proven. Across a typical program most tests will not produce a winner, which is exactly why the rigor matters. It ties into our broader conversion optimization work.
Frequently asked questions
How much traffic do I need to A/B test?
It depends on your baseline conversion rate and the size of the lift you want to detect. There’s no universal number, but smaller effects need far more traffic (halving the effect roughly quadruples the sample). Low-traffic stores should test bold changes, not small tweaks. Always calculate before starting.
What does 95% statistical significance mean?
It means there’s only a 5% chance the difference you measured is due to random chance rather than a real effect. It’s the ecommerce standard for calling a winner, but it must be paired with hitting your pre-calculated sample size, 95% on too little data is unreliable.
How long should an A/B test run?
Until it reaches the required sample size and covers full business cycles, usually one to two weeks minimum, often two to four. Don’t stop early because a variant looks like it’s winning; early leads frequently reverse as more data comes in.
Can a small store with low traffic still A/B test?
Yes, but only for bold changes that produce large, detectable lifts, not subtle tweaks. Very low-traffic stores may be better served by diagnostic work (session recordings, funnel analysis) and fixing clear problems, then testing once there’s enough traffic to measure.
What's a good A/B test win rate?
Published figures range from about 12% to 36% depending on how a win is defined, so anywhere in the 15% to 25% band is unremarkable. The number matters less than the pattern: if you’re winning nearly every test, your changes are probably too timid; if you almost never win, your hypotheses may need better grounding in real user data. The learning from losing tests still sharpens the next round.
Keep reading
Sources
A/B testing statistical standards: 95% significance (p < 0.05) and 80% power are the ecommerce norm; sample size depends on baseline rate, MDE, power, and significance; halving MDE roughly quadruples required sample. Corroborated across multiple 2026 analyses. https://www.digitalapplied.com/blog/conversion-rate-optimization-2026-ab-testing-guide ; https://growth-engines.com/insights/ecommerce/ecommerce-a-b-testing-the-data-driven-guide-to-higher-conversions
Sample-size reference table: calculated by us using the standard two-proportion test at 95% significance and 80% power, then rounded (e.g. ~37,000 per variation to detect a 15% lift at a 2% baseline). Background reading on the method: https://growth-engines.com/insights/ecommerce/ecommerce-a-b-testing-the-data-driven-guide-to-higher-conversions ; https://www.mantasdigital.com/cro-2/ab-testing-small-ecommerce-stores/
Win rate: published figures vary widely by how a “win” is defined, from about 12% (Optimizely, across roughly 127,000 experiments) and around 14% (VWO) up to 36% in research-led agency datasets, with 20% to 22% commonly cited. We describe the range rather than presenting a single number as typical. Small stores should test bold changes. https://grow-conversions.com/blog/ab-testing-best-practices/