What determines how much traffic an A/B test needs?
Four things: your baseline conversion rate, the minimum lift you want to detect (MDE), your confidence level, and your statistical power. Change any one and the required traffic changes, sometimes dramatically.
The four inputs work together:
Baseline conversion rate. Your current rate. Higher baselines produce more conversion events per visitor, so they need less traffic to reach a reliable result.
Minimum detectable effect (MDE). The smallest lift you want the test to catch. This is the biggest lever, and the one stores most often set wrong.
Confidence level. Usually 95%, meaning a 5% chance of a false positive.
Statistical power. Usually 80%, meaning a 20% chance of missing a real effect.
Confidence and power are near-universal standards (95% and 80%), so in practice the two numbers you control are your baseline rate and your MDE. And MDE is where the traffic requirement explodes or shrinks.
Why do small improvements need so much more traffic?
Because the relationship between effect size and sample size is exponential, not linear. Halving the lift you want to detect roughly quadruples the traffic you need. Detecting tiny changes reliably takes enormous volume.
This is the single most important thing to understand about A/B testing traffic, and the most counterintuitive. It’s tempting to set a small MDE so you can catch even minor improvements, but the cost is steep. At a 3% baseline conversion rate, detecting a 5% relative lift needs roughly 100,000+ visitors per variation, while detecting a 10% lift needs about a quarter of that. That’s why a tiny “change the button color” test is effectively untestable for most stores: the effect is too small to detect without traffic they don’t have. The practical rule that falls out of this: if you can’t reach the sample size for a small change, don’t test small changes.
How much traffic do I actually need? (reference table)
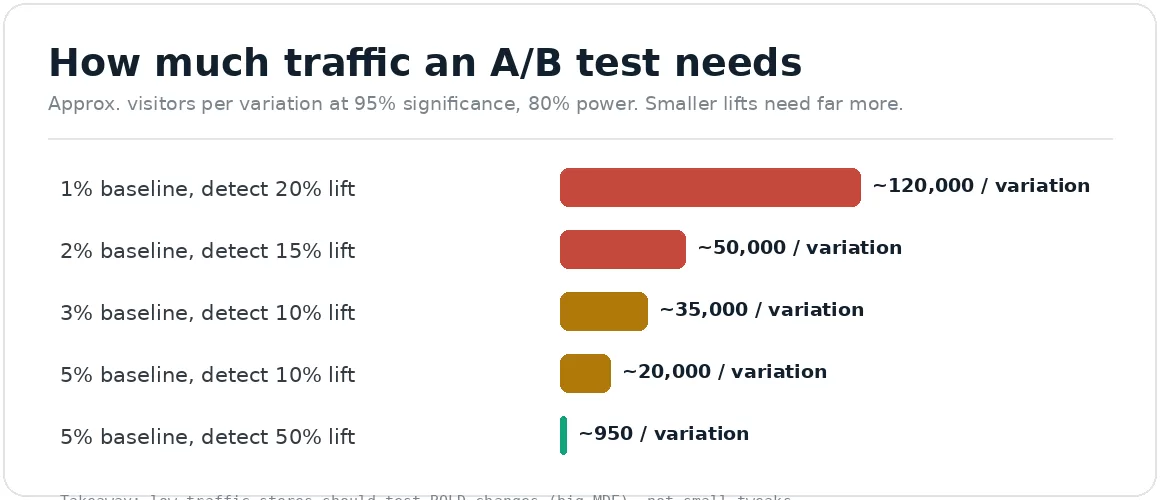
At standard settings (95% significance, 80% power), here’s a practical reference. Treat these as approximate, always run your own calculation, but the pattern is what matters.
Source: compiled from multiple 2026 A/B testing sample-size analyses. Approximate; depends on exact inputs.
Read the last two rows together: at the same 5% baseline, dropping from a 50% target lift to a 10% target lift takes the requirement from about 1,500 visitors to about 31,000. Same store, same baseline, vastly different traffic, purely because of how small a change you’re trying to detect.
Calculated at the standard 95% significance and 80% power, using the two-proportion test, and rounded. Numbers are per variation, so an A/B test needs the total column. Two things fall out of the maths. Smaller lifts need dramatically more traffic, because required sample scales with the inverse square of the effect: halving the lift you want to detect roughly quadruples the traffic. And a higher baseline needs less traffic for the same relative lift. That is why a low-traffic store should test bold changes rather than small ones. Run your own numbers before every test; these are a reference, not a substitute for a calculator.
How do I calculate my own sample size?
Use a free sample-size calculator, plug in your baseline rate and target MDE at 95% significance and 80% power, and it gives you the visitors needed per variation. Then divide by your traffic to get the test duration.
You don’t need to do the math by hand. Free tools like Evan Miller’s calculator, or the built-in calculators in Optimizely, VWO, and similar, do it for you. The process: enter your current conversion rate, choose the smallest lift worth detecting, keep 95% confidence and 80% power, and read off the required sample per variation. Then a simple division, required sample divided by your weekly traffic to that page, tells you how many weeks the test must run. If that comes out to six months, the test isn’t viable as designed, and you either need a bigger MDE (a bolder change) or more traffic.
What if I don't have enough traffic?
Test bigger, bolder changes that produce large effects, not subtle tweaks. Big changes have large MDEs, which need far less traffic to detect. Low-traffic stores win by being ambitious, not incremental.
This is the reframe that lets small stores test at all. You can’t reliably detect a 5% lift, but you can detect a 30 to 50% one, and bold changes (a rebuilt product page, a fundamentally different checkout flow, a completely new value proposition) are exactly the kind that produce lifts that big. So instead of testing button colors, test the things that could genuinely move the needle. And for the parts you can’t test, lean on diagnostic tools: session recordings and funnel analysis, part of our analytics and tracking work, reveal clear problems you can just fix, no traffic threshold required. That diagnostic-first approach is covered in how to diagnose Shopify conversion issues, and is part of our conversion optimization work.
Does running more variations change the traffic I need?
Yes. Each additional variation needs its own full sample, and testing multiple variants at once increases the total traffic required, often more than people expect. More variations means a longer test or more traffic.
A common misconception is that adding a third or fourth variation just needs “a bit more” traffic. In reality each variation needs its own adequately-powered sample, and comparing several at once introduces a multiple-comparison problem that, corrected for properly, pushes the per-variation requirement up further. For most stores, especially lower-traffic ones, that means testing two versions at a time (a clean A/B) is far more practical than a multi-variant test. Save multivariate testing for when you have the traffic to support it.