Benchmarks / Shopify
How Does My Conversion Rate Compare to Industry Benchmarks?
// make the comparison fair before you read anything into it

By Fracto Solutions
August 1, 2026
The short answer
Four things have to match before a comparison means anything: the denominator, your category, your device split and your traffic mix. Skip any one and the benchmark misleads you. Comparing a blended Shopify number to a blended ecommerce average is the most common way stores misread their own performance.
Most conversion-rate comparisons are wrong before they start, because the two numbers being held against each other were never measuring the same thing. Getting it right is a four-step check, and the first step does most of the work.
For the benchmark figures themselves, see the benchmarks pillar. For what a good Shopify rate looks like, see what counts as a good conversion rate.
Why can't I just compare my rate to the average?
Because “the average” blends stores that behave nothing like yours, and it is usually calculated differently from your own number.
- The four checks
01
Match the denominator
Sessions or unique visitors. They give different numbers for the same store.
02
Match your category
At your price point. On Shopify session data the spread is about 9.5x.
03
Split by device
Mobile and desktop convert differently. A blended number hides both.
04
Account for traffic mix
Channels convert several times apart. Compare each to its own floor.
Do all four before you read anything into a gap. Skipping one is enough to turn a healthy store into an apparent problem.
Step 1 : Am I measuring the same way?
Check the denominator first. Session-based and visitor-based rates describe the same store with very different numbers.
Shopify Analytics and GA4 both report session-based by default, meaning orders divided by sessions, and most benchmarks mean the same thing. But the widely circulated industry table on Shopify’s guide is visitor-based, counting each person once, which runs higher.
There is no fixed conversion factor between the two. People often quote a tidy multiplier, but when you line up the same category measured both ways, the gap moves a lot, because sample and geography ride along with the denominator.
- Same category, two measurements
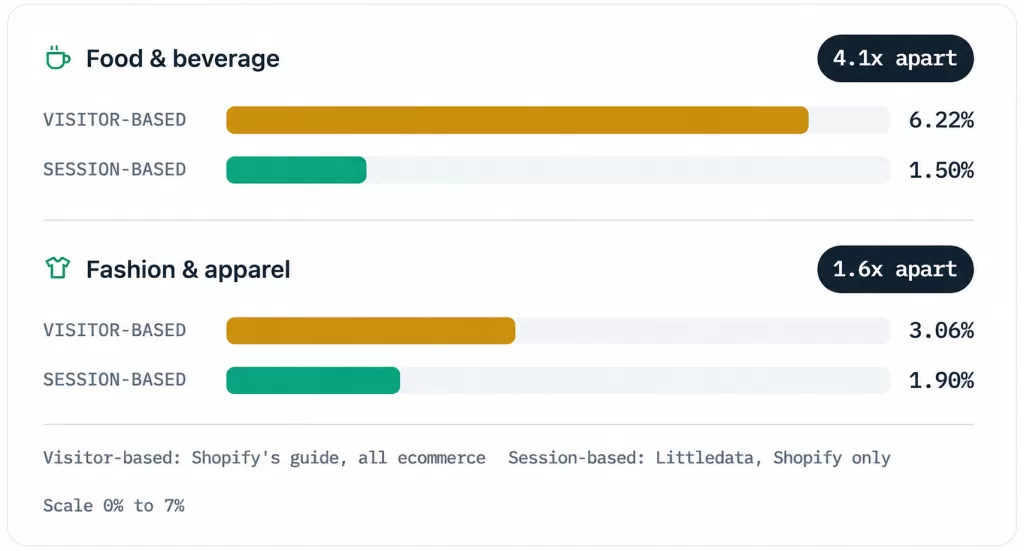
Two categories, each measured both ways. Food is 4.1x apart and fashion only 1.6x, which is why a single conversion factor cannot be trusted. Match the denominator instead of trying to convert between them.
So if GA4 reports 1.8% for your fashion store and a table quotes 3.06% for fashion, you may have no problem at all. The Shopify session figure for fashion is 1.9%, and you are essentially at it.
Step 2 : Am I comparing to my category, at my price point?
Match your category on a source using your denominator. On Shopify session data the highest and lowest categories are about 9.5x apart.
This is where most comparisons break. Blended ecommerce tables put food and beverage above 6%, which sends food merchants looking for problems they do not have. Littledata measures the same category on Shopify, session-based, and gets 1.5%.
- Shopify categories, session-based
Fashion
top 20% 4.3%
top 10% 6.1%
Food & bev
top 20% 4.1%
top 10% 6.2%
All Shopify
top 20% 3.2%
top 10% 4.7%
Travel
top 20% 2.0%
top 10% 3.4%
Finance
top 20% 2.2%
top 10% 3.2%
- Category average
- | Top 20% threshold
- Headroom to the top 10%
- Scale 0% to 7%
Littledata's Shopify benchmark, session-to-order, from its 2023 study of 2,800 sites. Fashion at 1.9% against travel and finance at 0.2% is a 9.5x spread, wider than the blended ecommerce table suggests.
Price point drives most of this. A store with an $800 order value should expect a lower session rate than one at $150, because the purchase takes more sessions to decide. Compare to peers at your price point, not to the category headline.
Step 3 : Have I split my rate by device?
Always. A blended rate hides the mobile and desktop gap, which is the most common place a healthy store looks unhealthy.
- How much of the ceiling each device reaches
29%
DESKTOP
Average 1.9%
Top 10% reach 6.5%
31%
DESKTOP
Average 1.2%
Top 10% reach 3.9%
The headroom is the same on both. Mobile converts lower in absolute terms, but the average store sits at roughly 30% of its own top decile on each device. Mobile is not harder to improve, it simply starts from a lower ceiling and carries more of the traffic, which is why fixing it moves more revenue.
Rates from Littledata's Shopify benchmark, session-based. The ring shows each device's average as a share of its own top-decile figure.
Mobile also carries most of the money on that lower rate: in IRP’s June 2026 data it produced 63.5% of ecommerce sales, so a blended figure is dominated by the weaker-converting device. Compare mobile to mobile and desktop to desktop. Very often a soft blended number turns out to be a specific mobile checkout problem rather than a general one, and that is a fixable finding rather than a vague one.
Step 4 : Have I accounted for my traffic mix?
Yes, because channel changes the benchmark as much as category does. Where a visitor came from carries the intent they arrived with.
- Ecommerce conversion by channel, 2026
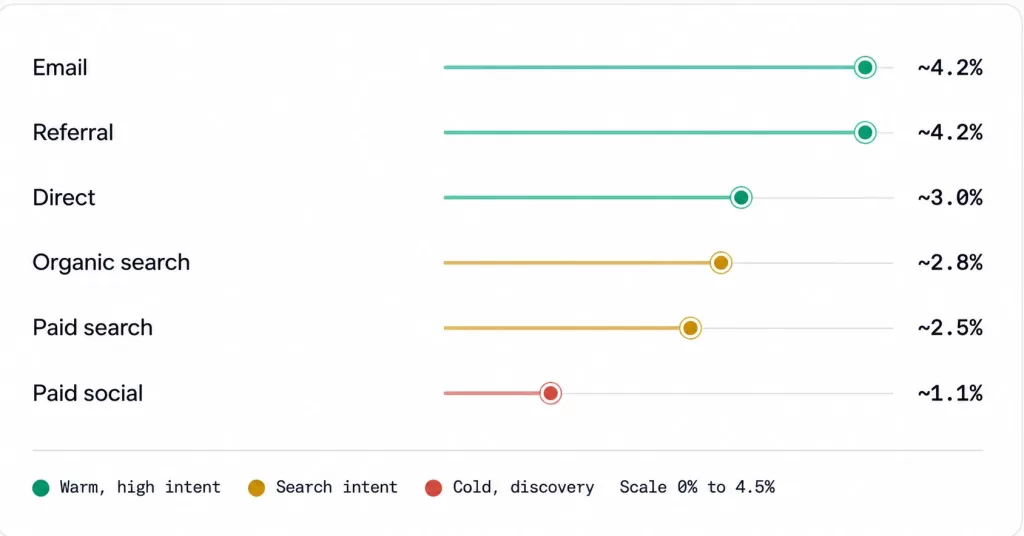
Midpoints compiled from 2026 ecommerce channel benchmark reporting. These are directional ranges rather than one measured dataset, so use them to set per-channel floors rather than as precise targets.
A store that is 80% paid social will show a lower blended rate than one that is 80% email, and both can be perfectly healthy. Judge each channel against its own floor. And do not cut paid social on the strength of its last-click number alone: it is a discovery channel, and last-click attribution systematically undercounts what it contributes.
So how do I actually run the comparison?
Build your own like-for-like benchmark rather than measuring yourself against a published one. Then read the gaps as questions, not verdicts.
- Confirm your denominator. Session-based in Shopify Analytics and GA4 by default. Only compare to sources using the same.
- Pull your category on a matching source. For Shopify stores that means Shopify session data, not a blended ecommerce table.
- Split by device and line each half up separately. Mobile to mobile, desktop to desktop.
- Segment by channel and set a floor per channel. A blended target hides which channel is actually underperforming.
Where a single segment lags, that is the part of the funnel to investigate, and the benchmark has done its job. From there you diagnose directly rather than guessing: there is a walkthrough in how to diagnose Shopify conversion issues, clean measurement depends on accurate tracking, and if the gap turns out to be structural rather than one leak, a full CRO audit is the next step.
We build you a like-for-like benchmark, then find the real gap.
A fair comparison needs your denominator, your category at your price point, and your device and channel split. We assemble that first, then read your funnel where a segment lags, so you fix the real gap instead of chasing a number that never applied to you.
On one engagement that approach lifted a client’s conversion rate by 6% and revenue per visitor by 7%, both A/B tested at 95% confidence.
Frequently asked questions
Why does my rate look lower than my industry's average?
Usually because the average is visitor-based while yours is session-based, or because it blends categories, price points and devices. Match the denominator first, then segment your own rate, before concluding anything.
Should I compare blended or segmented rates?
Segmented. A blended rate hides the device and channel differences that explain most apparent gaps. Compare mobile to mobile and paid social to paid social.
How do I find my industry's benchmark?
Littledata publishes Shopify-specific session-based figures by category, IRP Commerce publishes UK and Ireland market data monthly, and Shopify’s guide carries a visitor-based table sourced from Dynamic Yield. Check which denominator each uses and pick the one matching how you measure.
Is there a formula for converting visitor-based to session-based?
Not a reliable one. On Shopify data the same category can be 4.1x apart for food and beverage but only 1.6x apart for fashion, because sample and geography differ alongside the denominator. Find a source using your denominator instead of converting between them.
My rate is below benchmark, what should I do first?
Do not optimise blindly. Identify which segment lags, whether that is a device, a channel or a funnel step, then diagnose that area with analytics plus session recordings before changing anything.
Keep reading
Sources
Session-to-order · 2,800 Shopify sites, studied 2023· littledata.io
12-month averages, visitor-based, via Dynamic Yield· shopify.com
First-party B2C data, UK and Ireland only · updated monthly· irpcommerce.com
Directional ranges, not one measured dataset