Benchmarks / Ecommerce
Ecommerce Conversion Rate Benchmarks by Industry (2026)
// every number here comes with the sample it was measured on

By Fracto Solutions
August 1, 2026
The short answer
There is no single average ecommerce conversion rate, and the honest version of the answer is a band: roughly 1.4% to 3%, with each source measuring a different set of stores. For Shopify specifically the median is 1.4%, and 3.2% puts you in the top 20%. Before you use any of these numbers, check that it counts the same thing your analytics counts.
Open five benchmark reports and you will get five different numbers for the same question. None of them is wrong. One counted Shopify stores, one counted a national market, one counted enterprise brands already running personalization software, and at least one divided by a different denominator than your analytics does. A benchmark is only usable once you know which stores are inside it, so every figure on this page is published with its sample, its measurement method, and its date.
What is the average ecommerce conversion rate in 2026?
Between about 1.4% and 3%, and where a source lands is mostly a function of who it measured rather than how those stores are performing.
- Four 2026 sources, four numbers
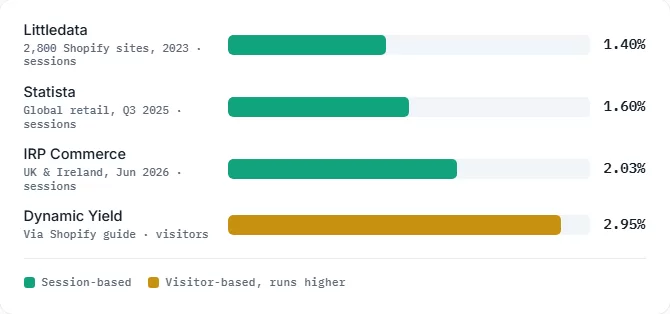
The spread is not disagreement. Three of these divide by sessions and one divides by visitors, and each drew from a different population of stores.
If you run a small or mid-size Shopify store, Littledata’s 1.4% is the closest comparison available, because its sample is other Shopify stores rather than all of ecommerce. One caveat worth knowing, since almost nobody states it: that benchmark comes from a study of 2,800 Shopify sites run in 2023. It is still the most widely quoted Shopify figure in 2026 and no newer platform-wide replacement has been published, but it is a three-year-old baseline, not a live one. Dynamic Yield’s figure sits higher for two compounding reasons: its sample skews toward larger brands already running testing and personalization programs, and it divides by visitors rather than sessions.
- Where your rate sits, on Shopify
4.7%+
Top 10% of Shopify stores
Rare. Usually strong product-market fit plus a sustained testing program, not a single fix.
3.2%+
Top 20% of Shopify stores
Your funnel works. The next gains typically come from order value and repeat purchase, not conversion rate.
1% to 3%
Where most stores sit
Median is 1.4%. This is the range where structured CRO work pays back fastest.
Under 1%
Diagnose before you test
Something upstream is usually the cause: tracking, traffic quality, or a broken step in the funnel.
Thresholds from Littledata’s Shopify benchmark (2,800 sites, studied 2023), measured session-to-order. Treat them as a diagnostic reading, not a target to chase.
Why do conversion rate benchmarks vary so much?
Mostly because “conversion rate” describes three different calculations, and published benchmarks rarely state which one they used.
Session-based divides orders by sessions. That is what Shopify Analytics reports, what GA4 reports, and what most benchmarks mean. Visitor-based divides by unique people and therefore runs higher, because one person can open several sessions before buying. Pageview-based is lower again and rarely quoted.
The size of that effect is larger than most people expect, and it is not a fixed multiplier. Published estimates put visitor-based rates at roughly two to three times the session-based figure for the same store, but the real gap between any two benchmarks also carries differences in sample and geography on top of the denominator. So a store reading 1.8% in GA4 and a table quoting 3.06% for its category may be performing perfectly well, and simply comparing two things that were never the same measurement.
One category, three published numbers
Take food and beverage. Shopify’s table puts it at 6.22%, measured against visitors across all ecommerce. Littledata’s Shopify benchmark puts food and beverage stores at 1.5%, measured session-to-order on the Shopify platform. IRP’s June 2026 data puts UK and Irish food and drink at 1.31%, also session-based. None of these is wrong and none of them describes a different quality of store. If you sell food and read only the first number, you will conclude your store is broken when it may be ahead of its category.
What is a good conversion rate by industry?
It depends heavily on what you sell. Across Shopify’s table the highest and lowest categories are about 6.6x apart, which is why a single blended average misleads almost everyone who uses it.
- Conversion rate by industry, visitor-based
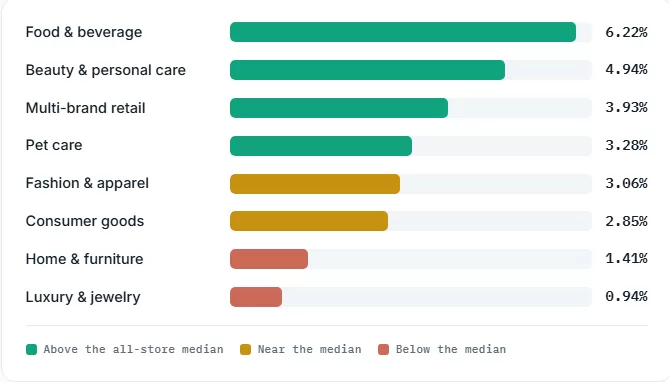
Shopify’s published 12-month industry averages, sourced from Dynamic Yield and calculated against visitors. Use the ranking with confidence; treat the absolute values as visitor-based figures, not something to compare directly against your Shopify Analytics number.
This is not an argument for changing what you sell. A $15 face cream needs far less consideration than a $2,000 sofa, so categories with higher order values show lower session conversion by design. A luxury store at 1.5% may be well ahead of its category while a food store at 3% is behind its own. Compare to your peer group at your price point, not to a headline average.
What do the same industries look like on a session-based source?
Considerably lower, and in a different order. This is the comparison most benchmark articles leave out, and it is the fastest way to see how much method matters.
IRP Commerce publishes first-party trading data from UK and Irish stores, measured as transactions divided by sessions. Because it updates monthly, it also shows something a static table cannot: which direction each category is moving.
- UK & Ireland, session-based, June 2026
Market
Conversion rate
Change vs Jun 2025
Arts and crafts
5.53%
+37.1%
Kitchen & home appliances
5.53%
-22.8%
Pet care
2.70%
-2.2%
Health and wellbeing
2.58%
+13.6%
Sports and recreation
1.95%
+15.0%
Cars and motorcycling
1.78%
+46.0%
Fashion, clothing & accessories
1.70%
+13.1%
Toys, games & collectables
1.63%
-33.9%
Food & drink
1.31%
+15.6%
Baby & child
0.51%
-33.2%
IRP Commerce market data, June 2026. First-party trading data from UK and Irish B2C stores. Every figure is transactions divided by sessions.
The year-on-year column is worth more than the absolute number. If your rate held flat while your category fell 30%, you outperformed, and a static benchmark table would have told you that you were failing.
Does conversion rate differ by device?
Yes, and it is the most consistent finding in every benchmark report. Mobile converts lower than desktop in essentially every dataset.
- Desktop against mobile, Shopify
1.9%
Carries 35% of sales
MOBILE
1.2%
Converts 37% lower
Carries 63.5% of sales
The inversion is the point. The device that converts worst brings in most of the money, which is why mobile checkout is usually the highest-leverage project on a store.
Conversion rates from Littledata’s Shopify benchmark, session-based. The averages hide a wide top end: the best 10% of stores reach 3.9% on mobile and 6.5% on desktop. Device share of sales from IRP Commerce, June 2026.
Note the distinction between traffic and orders, because it is easy to blur. Mobile typically accounts for a larger share of sessions than of completed orders, precisely because it converts worse. If your blended rate looks soft, split it by device before concluding anything: a healthy desktop number is often being dragged down by a mobile checkout that needs work.
Does traffic source change the benchmark?
As much as industry does. Where a visitor came from carries the intent and trust they arrived with, and that shows up directly in the rate.
- Ecommerce conversion by channel, 2026
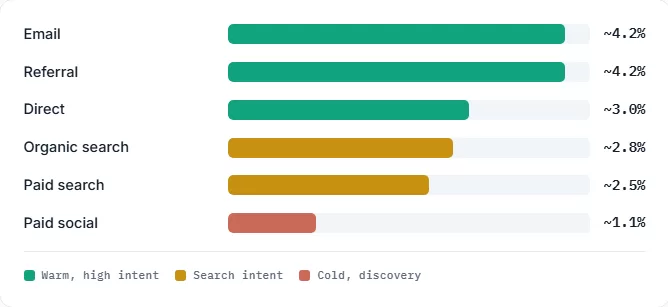
Midpoints compiled from 2026 ecommerce channel benchmarks. These are directional ranges rather than a single measured dataset, so use them to set per-channel floors, not as precise targets.
Email and referral lead on rate, but referral usually carries a fraction of email’s volume, so identical percentages mean very different revenue. Paid social sits lowest and is often cut for that reason, which is usually a mistake: it is a top-of-funnel channel, and its last-click rate undercounts what it contributes. In IRP’s June 2026 data, paid social accounted for just 0.5% of tracked sales under last-click attribution, which tells you more about the attribution model than about the channel.
Does it matter whether a visitor is new or returning?
More than device does, and often more than industry. Returning customers convert at roughly two to three times the rate of first-time visitors across every dataset that splits them.
One 2026 compilation puts returning customers at 4.5% to 6% and first-time visitors at 1% to 2%. The mechanism is obvious once stated: a returning buyer has already resolved the questions a new visitor is still working through, so they skip comparison and go straight to checkout.
This has a direct consequence for how you read your own number. Two stores with identical funnels will report very different blended rates if one has a 45% returning-customer share and the other has 10%. A brand new store is structurally disadvantaged on this metric and should expect to sit low, while an established store carrying heavy repeat traffic can look strong on a funnel that actually needs work. Split new against returning before you conclude anything, and track the two separately over time.
How does AI referral traffic compare?
It is now the highest-intent channel most stores have, and it is growing faster than anything else. It is also the channel most likely to be misattributed in your analytics.
Shopify’s own Q1 2026 data found that visitors arriving from AI assistants converted at nearly 50% higher rates than organic search visitors on product detail pages, and outperformed organic in 23 of 25 merchant categories. Those orders carried 14% higher average order values. Referral sessions from AI tools grew more than 8x year on year across Shopify storefronts, with orders from them growing close to 13x.
The reason is buyer journey compression. More than half of AI-referred sessions land directly on a product page against roughly 20% for organic search, because the assistant has already done the comparison and sends the shopper to a decision rather than to a homepage.
Two caveats before you act on this
The size of the advantage depends on who measured it. An independent study of 94 ecommerce sites found ChatGPT traffic converting at 1.81% against 1.39% for non-branded organic, a 31% edge rather than 50%. And organic search still refers more sessions to Shopify merchants than every tracked AI platform combined. More importantly for measurement: referrals from Google AI Overviews are classified as organic search in standard analytics, not as AI, so your reported AI numbers almost certainly understate the real figure.
How do I compare my store to these benchmarks correctly?
- Check your own number
Rebuild the benchmark to match your store rather than measuring yourself against a published one: same denominator, your industry at your price point, split by device and channel.
Four checks, in order. Confirm whether your number is session-based or visitor-based, and only compare like with like. Find your industry’s figure on a source using the same denominator. Split your own rate by device and compare mobile to mobile. Then segment by channel and hold each one against its own floor. Where a single segment lags, that is the part of the funnel to investigate, and the benchmark has done its job.
Build your like-for-like benchmark
Pick your category and denominator, then enter your rate. Nothing is sent anywhere.
Your category
All Shopify stores
How you measure
Sessions (Shopify, GA4)
Your conversion rate (%)
1.80
In line with your category average.
Littledata puts all shopify stores at 1.40% on average, with 3.20% for the top 20% and 4.70% for the top 10%, all session-based. Split your number by device and channel before acting on it.
The first three categories use Littledata’s published Shopify session-based averages and tier thresholds directly. The rest have no published Shopify session figure, so the tool converts Shopify’s visitor-based table into an estimated session range by dividing by two to three, and labels the result as approximate. This is a directional check, not a verdict on your store.
Four ways these numbers get misread
01. Comparing across denominators. A session-based rate against a visitor-based table will always look weak, by a factor of two to three.
02. Chasing the blended number. It averages a healthy desktop funnel with a broken mobile one and hides both.
03. Ignoring geography and date. A UK monthly figure and a global annual one are not interchangeable, and neither is a 2025 figure on a 2026 decision.
04. Reading rate without order value. A store at 1.5% on a $200 order value earns $3.00 per session. One at 3% on $80 earns $2.40. Track revenue per session, not conversion rate alone.
If your tracking itself is the uncertain part, fix that before comparing anything, since every figure above depends on clean measurement. Our analytics and tracking work covers that, and how to diagnose Shopify conversion issues covers what to do once the numbers are trustworthy. If the gap turns out to be structural rather than a single leak, a full CRO audit is the next step.
We use benchmarks as a diagnostic starting point, never the goal.
A benchmark tells you where to look first, not what to chase. We match your store to the right comparison, your denominator, industry, device split and channel mix, then read your own funnel to find where the revenue is actually leaking.
On one recent engagement that approach lifted a client’s conversion rate by 6% and revenue per visitor by 7%, both A/B tested at 95% confidence. The benchmark said the store was below its peer group. The funnel told us why.
Frequently asked questions
What's the average ecommerce conversion rate in 2026?
There isn’t one figure, there’s a band from roughly 1.4% to 3%, and where a source lands depends on which stores it counted. Littledata’s Shopify benchmark is 1.4%. IRP Commerce measured 2.03% across UK and Irish stores in June 2026. Dynamic Yield, quoted in Shopify’s guide, reports 2.95% against a visitor denominator. If you run a small or mid-size Shopify store, 1.4% is the closest comparison.
What's a good Shopify conversion rate?
Littledata puts the top 20% of Shopify stores above 3.2% and the top 10% above 4.7%. The median is 1.4% and most stores sit between 1% and 3%. Under 1% usually points to a problem worth diagnosing before any testing starts.
Which industries have the highest conversion rates?
On Shopify’s visitor-based table, food and beverage leads at 6.22% and beauty follows at 4.94%, while home and furniture sits at 1.41% and luxury and jewelry at 0.94%. Ranking is more reliable than the absolute figures, since a session-based source puts the same categories much lower.
Why is mobile conversion lower than desktop?
Littledata measures Shopify mobile at 1.2% against desktop at 1.9%, a gap of roughly 37%. Mobile still produced 63.5% of sales in IRP’s June 2026 data, so the lower-converting device carries the larger share of revenue. That combination makes mobile checkout the highest-leverage fix on most stores.
Should I compare my store to a global average?
No. Match the denominator first, then your industry and price point, then your device split and channel mix. A global average blends categories, geographies and measurement methods that behave nothing like each other.
Does traffic from ChatGPT and other AI assistants convert better?
On Shopify’s Q1 2026 data, yes: AI-referred visitors converted at nearly 50% higher rates than organic search visitors on product detail pages, and those orders carried 14% higher average order values. An independent study of 94 ecommerce sites measured a smaller 31% advantage, so treat the size of the gap as uncertain. Note also that Google AI Overviews referrals are recorded as organic search, so your reported AI figures likely understate the real number.
Keep reading
Sources
1.4% average · top 20% >3.2% · top 10% >4.7% · mobile 1.2% / desktop 1.9% · food & beverage 1.5% · fashion 1.9% · session-to-order · 2,800 Shopify sites, studied 2023 · littledata.io
Cross-market 2.03% · transactions ÷ sessions · first-party B2C trading data, GB, NI and Ireland only · updated monthly · irpcommerce.com
12-month averages, visitor-based, via Dynamic Yield · Q1 2026 AI commerce data · shopify.com
Directional ranges, not one measured dataset.