Benchmarks / Shopify

What Is a Good Conversion Rate for a Shopify Store?

// average is not the same as good

logo

By Fracto Solutions

August 3, 2026

The short answer

A good Shopify conversion rate is 3.2% or higher, which puts you in the top 20% of stores. The average is 1.4% and the top 10% sit above 4.7%. All of those are session-based, measured on Shopify stores specifically, which matters because most published category figures are neither.

Two layers to this question. There is the benchmark number, and there is whether that number was measured on stores like yours at all. Most articles answer the first and quietly skip the second, which is how store owners end up comparing their Shopify Analytics figure against a number that was never calculated the same way.

For the full picture by industry, device and channel, see the benchmarks pillar.

What counts as a good Shopify conversion rate?

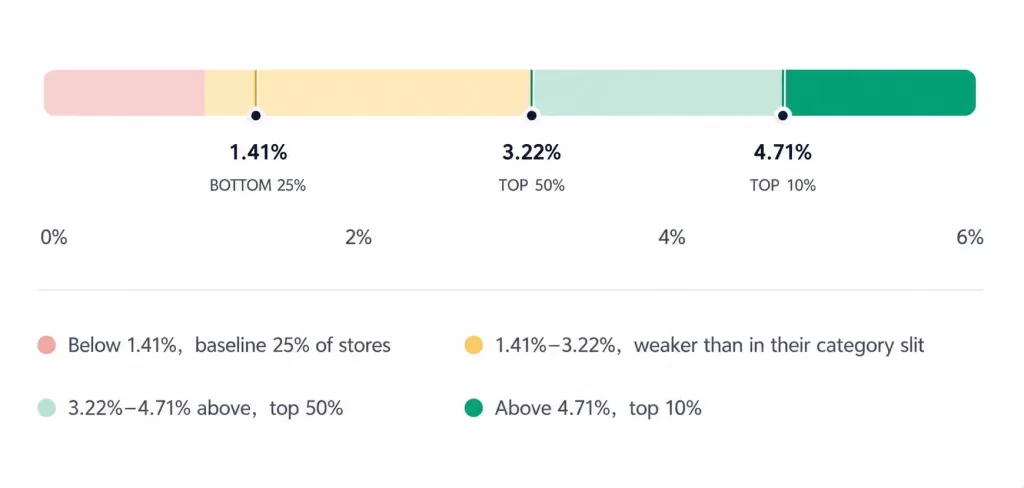
3.2% or higher puts you in the top 20% of Shopify stores. 4.7% or higher puts you in the top 10%. The average sits at 1.4%.

graph-average

Thresholds are Littledata's published Shopify figures, measured session-to-order, from its 2023 study of 2,800 sites. The under-1% marker is our own rule of thumb, not theirs: Littledata publishes no bottom threshold for Shopify stores overall.

Everything above is session-based, meaning orders divided by sessions, which is what Shopify Analytics reports by default. If you have read a higher number for the same category elsewhere, check the denominator before you conclude anything: a visitor-based figure counts each person once and therefore runs higher for the identical store.

What is the average Shopify conversion rate?

1.4%, from Littledata’s benchmark of 2,800 Shopify sites. That average includes newer and unoptimised stores, which pulls it down.

If you run an established store with steady traffic, the more useful target is not the average but the top 20% threshold at 3.2%, because that is the realistic ceiling for a well-run store. Benchmarking against the middle of a pack that includes abandoned stores tells you very little.

One caveat almost nobody states

Littledata’s Shopify benchmark comes from a study of 2,800 sites run in 2023. It is still the most widely quoted Shopify figure in 2026, and no newer platform-wide replacement has been published, but it is a three-year-old baseline rather than a live number. Treat it as a stable reference point, and weight your own trend over time more heavily than any external figure.

Is a 2% conversion rate good for Shopify?

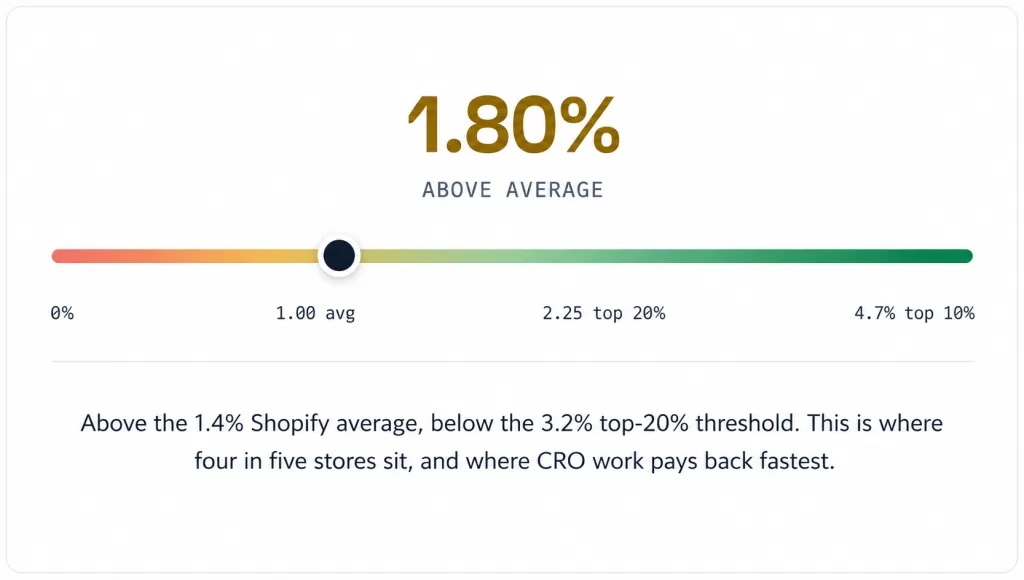
It is above the 1.4% average and below the 3.2% top-20% threshold, which is where four out of five Shopify stores sit. That is a healthy baseline with clear room to grow.

At 2% your funnel works and your traffic is reasonably matched to your offer. The question stops being “what is broken” and becomes “what is the next lever”, which is usually checkout friction, product page clarity, or a tighter match between the ad and the landing page. Stores move from 2% to 3% by fixing specific leaks, not by redesigning everything.

Does a good rate depend on what I sell?

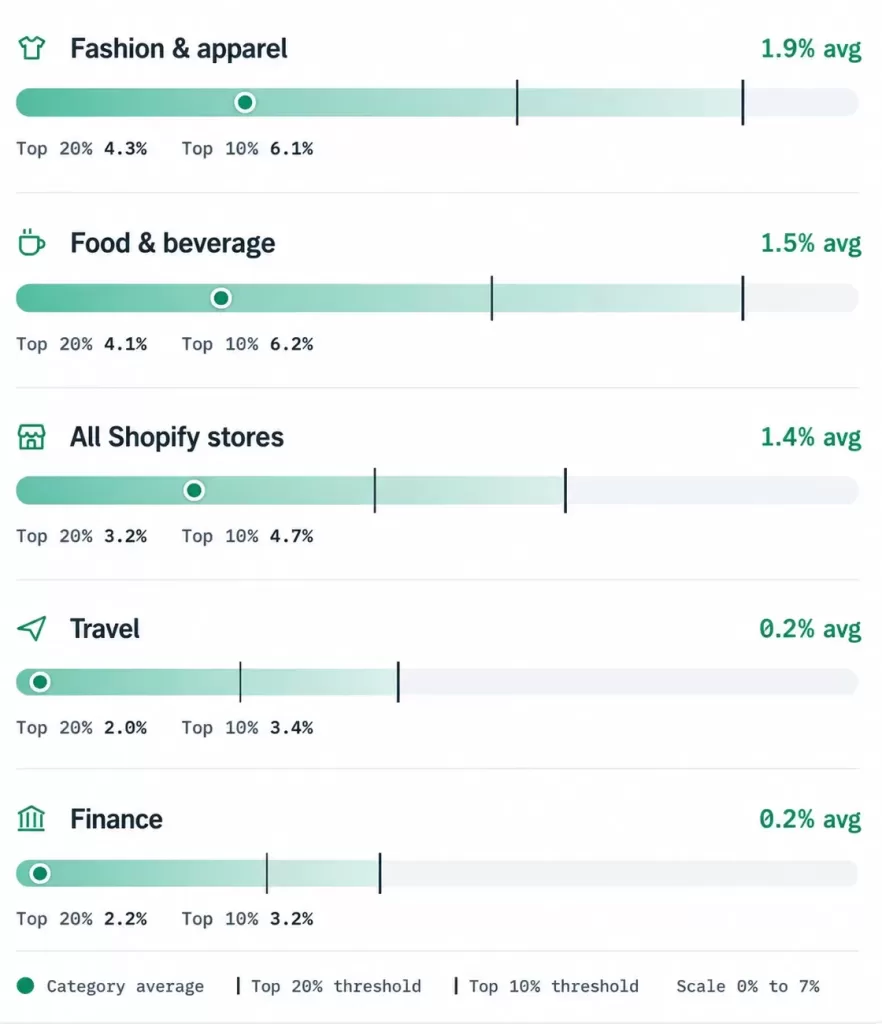
Yes, and by more than most people expect. On Shopify data alone, the average ranges from 1.9% down to 0.2% depending on the category.

Here is where most articles go wrong, so it is worth being precise. The widely circulated table showing food and beverage above 6% is measured against visitors, across all ecommerce, not on Shopify. Littledata publishes Shopify-specific, session-based figures for several categories, and they look very different.

fasion-graph

Littledata's Shopify benchmark, session-to-order, from its 2023 study of 2,800 sites. These are the right figures to hold your Shopify Analytics number against

Notice what this changes. A food and beverage store reading 2% in Shopify Analytics is above its category average of 1.5%, not far below the 6% it would have found in a blended ecommerce table. The blended figure is not fake, it simply describes a different measurement of a different population, and using it here would send a perfectly healthy store off to fix problems it does not have.

Littledata publishes the numbers but not the reasons, so the pattern underneath is our reading rather than theirs: price point and consideration time. Travel and finance most likely sit at 0.2% because those purchases run across multiple sessions and often complete somewhere other than a web checkout. Either way it is a structural property of the category, not a verdict on any single store.

Is a good rate different on mobile?

Yes. Mobile converts lower than desktop on Shopify, so a good mobile rate sits meaningfully below a good desktop rate.

Desktop

1.9%

Average Conversion

Top 10% reach 6.5%

Mobile

1.9%

Average Conversion

Top 10% reach 3.9%

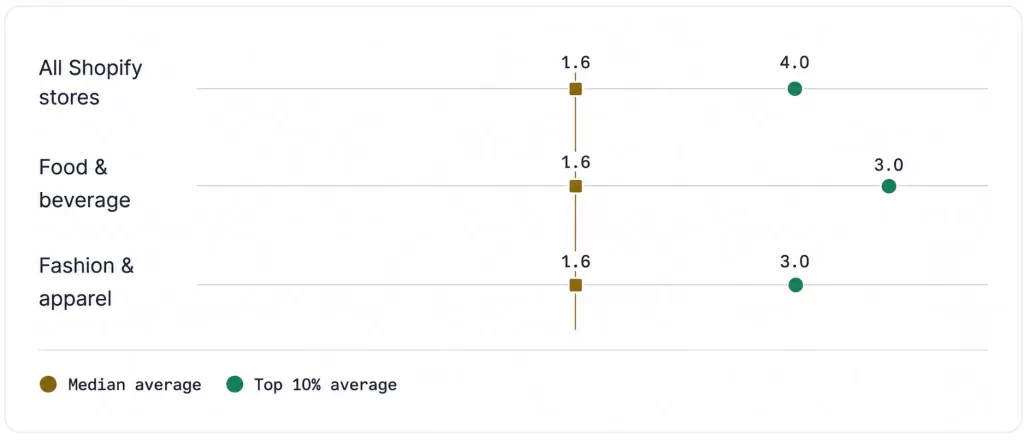
The top decile is the useful number here. The best stores reach 3.9% on mobile, more than triple the average, so the gap is a closable one rather than a hard ceiling.

Littledata's Shopify benchmark, session-based. Averages and top-decile figures as published.

shopify-average

Across every segment Littledata breaks out, mobile lands on exactly 1.2%. Desktop is the number that moves. Whatever holds mobile down is common to all of them, which makes mobile checkout a platform problem rather than a niche one.

Because mobile carries most of the traffic on a typical store, a blended number is dominated by the lower-converting device. If your overall rate looks soft, split it before concluding anything: a healthy desktop figure is often being dragged down by a mobile checkout that needs work.

How do I know if my rate is a problem?

Compare against your own category on a matching denominator, then against your own trend. A single number in isolation cannot tell you whether anything is wrong.

average

Session-based, against Littledata's all-Shopify thresholds. Compare your category row above before drawing conclusions, and split by device.

Three checks, in order. First, confirm your figure is session-based, since that is what every number on this page is. Second, hold it against your category row above rather than a blended ecommerce average. Third, split it by device, because a soft blended rate very often turns out to be a specific mobile problem rather than a general one.

If all three come back clean and you are still below your category average, that is the point where the number stops being the useful thing and the funnel becomes it. Pairing your analytics, which shows where people drop, with session recordings, which show why, is the fastest route to an answer. There is a full walkthrough in how to diagnose Shopify conversion issues, and if the gap turns out to be structural rather than a single leak, a full CRO audit is the next step.

How Fracto approaches this

We benchmark you against the right peer group, then close the gap.

The platform average is a low bar that includes abandoned stores. We compare your rate to the tier you are aiming for, matched to your category, denominator and device split, then read your funnel to find what is holding you below it.

On one engagement that lifted a client’s conversion rate by 6% and revenue per visitor by 7%, both A/B tested at 95% confidence.

// we would rather show up in your reporting than in your inbox

Frequently asked questions

Is 1.4% a good conversion rate for Shopify?

It is the platform average, so it is normal rather than good. Good is 3.2% or higher, which is Littledata’s top-20% threshold. At 1.4% nothing is necessarily broken, but for an established store there is usually room to improve.

The top 10% of Shopify stores exceed 4.7%. Within specific categories the top decile goes higher still: 6.2% for food and beverage and 6.1% for fashion. Rates at that level usually reflect strong product-market fit plus sustained optimisation rather than one change.

The top 20% at 3.2%, if you are established. The 1.4% average includes many new and unoptimised stores, which makes it a low bar for a serious operation.

Mobile converts lower than desktop in every segment Littledata measures. For Shopify stores overall it averages 1.2% against 1.9% on desktop, and that same 1.2% holds for food and beverage and for fashion. The top 10% of stores reach 3.9% on mobile, so the gap is closable rather than fixed. It is usually checkout friction on smaller screens, and since mobile carries most traffic it is often the biggest single opportunity on a store.

Because that figure is measured against unique visitors across all of ecommerce, not against sessions on Shopify. Littledata’s Shopify-specific, session-based average for food and beverage is 1.5%. Both numbers are real; they measure different populations with different denominators, so only one of them is comparable to your Shopify Analytics figure.

Keep reading

Sources

All Shopify stores 1.4% average · top 20% >3.2% · top 10% >4.7% · mobile 1.2% (top 10% >3.9%) · desktop 1.9% (top 10% >6.5%) · fashion 1.9% / 4.3% / 6.1% · food & beverage 1.5% / 4.1% / 6.2% · travel 0.2% / 2.0% / 3.4% · finance 0.2% / 2.2% / 3.2% · session-to-order · 2,800 Shopify sites, studied 2023 · littledata.io

12-month industry averages, visitor-based, sourced from Dynamic Yield · shopify.com