Conversion / Shopify
Why Shoppers Abandon Checkout (and How to Tell Which Reason Is Yours)
// find your leak before you fix it

By Fracto Solutions
July 30, 2026
The short answer
Shoppers abandon checkout mostly for fixable reasons: unexpected extra costs (40%), slow delivery (20%), not trusting the site with card details (19%), forced account creation (18%), and a checkout that’s too long (17%). The reason costing your store the most is knowable: read your funnel and watch where people stall.
Most advice lists the same top three reasons and stops there. That’s not enough to act on, because the reason hurting your store may not be the one hurting the average store. This article does two things: ranks the real reasons by how often they actually cause abandonment, then shows you how to work out which one is yours.
For the fixes themselves, see the cart and checkout abandonment guide. This piece is about identifying the culprit first.
What are the real reasons shoppers abandon checkout?
Once you set aside people who were only browsing (42% of abandonment, largely unrecoverable), the remaining reasons form a clear ranking.
- Why shoppers abandon, ranked
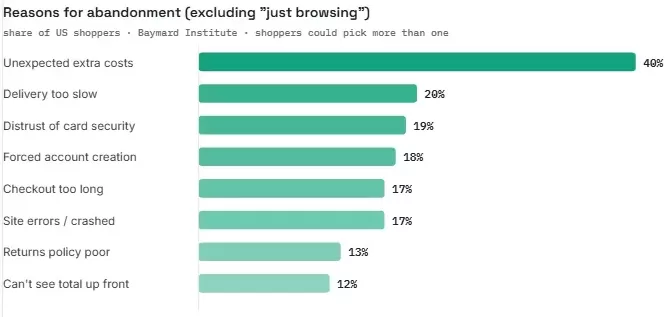
One reason dominates: unexpected extra costs, at 40%, cause more abandonment than any other. Most of the rest, trust, forced accounts, checkout length, are design and policy choices you control.
The pattern is striking: nearly every reason is something you control. Unlike the “just browsing” group, these are design and policy problems, and most can be fixed without a rebuild.
Why are unexpected costs the number one reason?
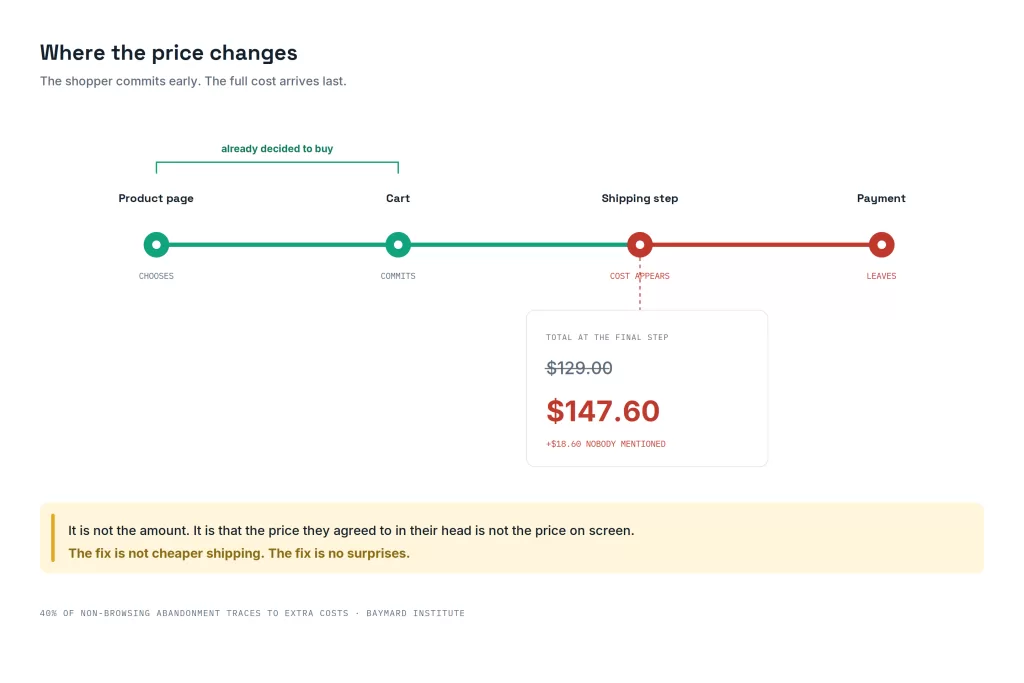
Because they break the deal at the worst possible moment, after the shopper has already decided to buy.
A shopper who reaches checkout has committed mentally. They’ve chosen the product, pictured owning it, and started entering details. When a shipping charge, tax line, or handling fee appears on the final screen, it doesn’t just add cost, it feels like a bait-and-switch. The price they agreed to in their head isn’t the price they’re being asked to pay.
That’s why 40% of non-browsing abandonment traces to extra costs, more than any other single reason. It’s also why “show the full cost early” is the highest-impact change most stores can make. The fix isn’t cheaper shipping; it’s no surprises.
How do I tell which reason is hurting my store?
Read your checkout funnel and pair it with session recordings. The combination tells you where people stall and why.
Start with the numbers. Shopify’s checkout analytics shows how many shoppers reach each step. The step with the steepest drop is your leak’s location. Then match the location to the likely reason:
01. Big drop right after shipping options appear points to cost or delivery.
02. Drop at the account or contact step points to forced account creation.
03. Drop at the payment step points to trust or payment friction.
04. Drop spread evenly across a long checkout points to length and complexity.
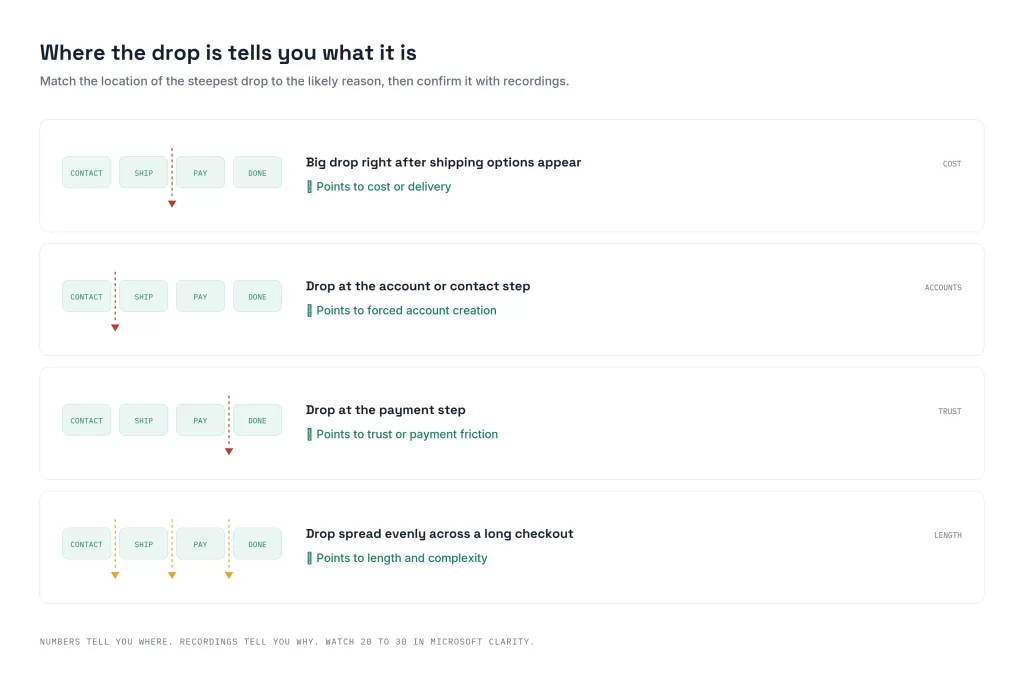
Then confirm with your eyes. Watch 20 to 30 session recordings of shoppers who abandoned, free in Microsoft Clarity. Numbers tell you where; recordings tell you why. There’s a fuller walkthrough in how to diagnose Shopify conversion issues.
How much is fixing this actually worth?
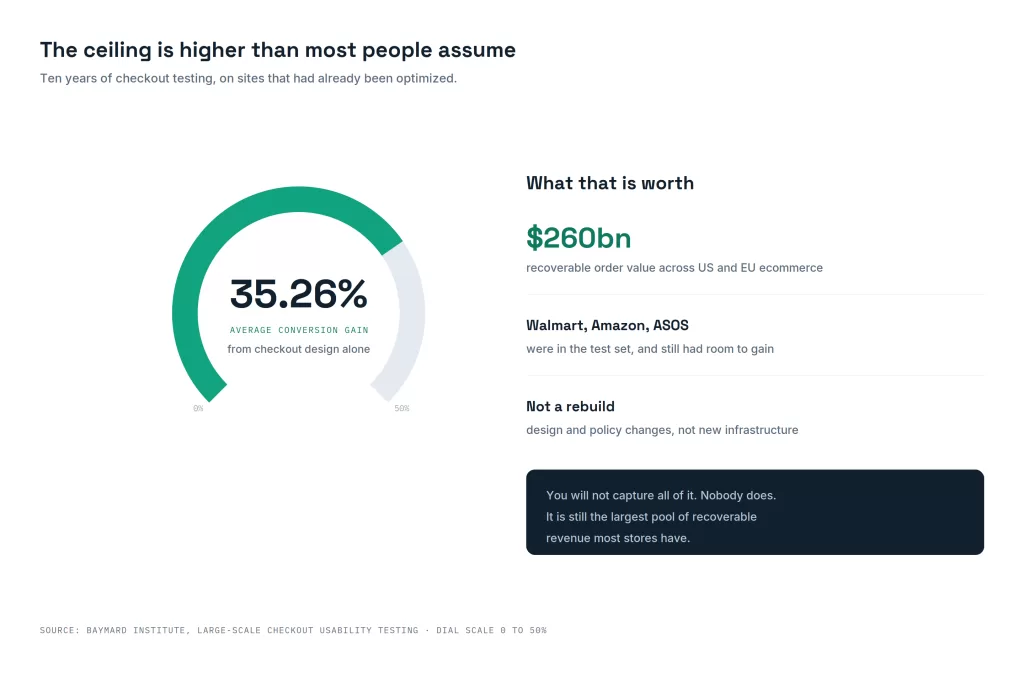
Enough to change the trajectory of a store. Baymard’s checkout testing puts the ceiling high.
Across ten years of large-scale checkout testing, Baymard found the average large ecommerce site could gain a 35.26% increase in conversion rate through better checkout design alone, and that’s after testing sites like Walmart, Amazon, and ASOS that have already optimized. Scaled across US and EU ecommerce, they estimate roughly $260 billion in lost orders is recoverable through better checkout flow and design.
You won’t capture all of that, no one does. But the point stands: checkout abandonment isn’t a rounding error to accept. It’s often the single largest pool of recoverable revenue a store has, and unlike buying more traffic, fixing it costs little and helps every future shopper.
- Shopify Admin — Abandoned checkouts
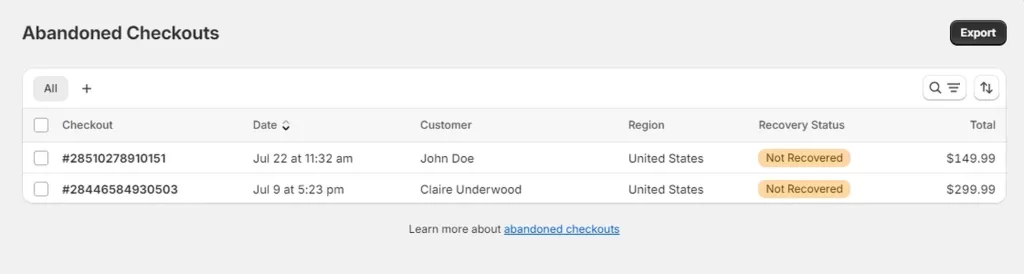
Shopify logs every abandoned checkout with its recovery status. Confirm the built-in recovery is switched on, then decide whether a dedicated flow is worth the extra reach.
Is checkout abandonment the same as cart abandonment?
No, and the difference matters for diagnosis. Cart abandonment is broader; checkout abandonment is the drop-off after someone actually begins checkout.
Cart abandonment counts everyone who added to cart and didn’t buy, including a large share who were never going to. Checkout abandonment is narrower and more actionable: these shoppers committed enough to start checkout, so when they leave, something in the checkout itself pushed them out. That makes checkout-stage drop-off the more useful number for deciding what to fix.
We diagnose the reason before prescribing the fix.
Generic checkout advice fixes the average store’s problem, not yours. We read your funnel, watch where real shoppers stall, and target the reason actually costing you the most, then prove the lift in your own analytics.
Frequently asked questions
What is the number one reason for checkout abandonment?
Unexpected extra costs. About 40% of shoppers abandon because shipping, taxes, or fees appear too high or too late, once you exclude people who were only browsing (Baymard). Showing the full cost early is the highest-impact fix.
What percentage abandon just because they're browsing?
Around 42% of cart abandonment is people who were browsing, comparing prices, or not ready to buy (Baymard). That group is largely unrecoverable, which is why you focus on the reasons you can actually fix.
How do I know which reason applies to my store?
Read your checkout funnel in Shopify analytics to find the step with the steepest drop, then watch session recordings to confirm why people leave there. The location of the drop points to the reason.
Can most checkout abandonment actually be fixed?
Yes. Nearly every top reason, costs, trust, forced accounts, checkout length, is a design or policy choice you control. Baymard estimates better checkout design alone could lift conversion meaningfully for most sites.
Keep reading
Sources
Baymard Institute, Cart Abandonment Rate Statistics and reasons-for-abandonment study (updated Sept 2025): 70.22% average; 42% just browsing; excluding browsing, extra costs 40%, slow delivery 20%, card distrust 19%, forced account 18%, complicated checkout 17%; 23.48 average form elements; 35.26% potential conversion gain; ~$260 billion recoverable — baymard.com