Conversion / Shopify
How to Diagnose Shopify Conversion Issues
// narrow it down before you fix anything

By Fracto Solutions
July 27, 2026
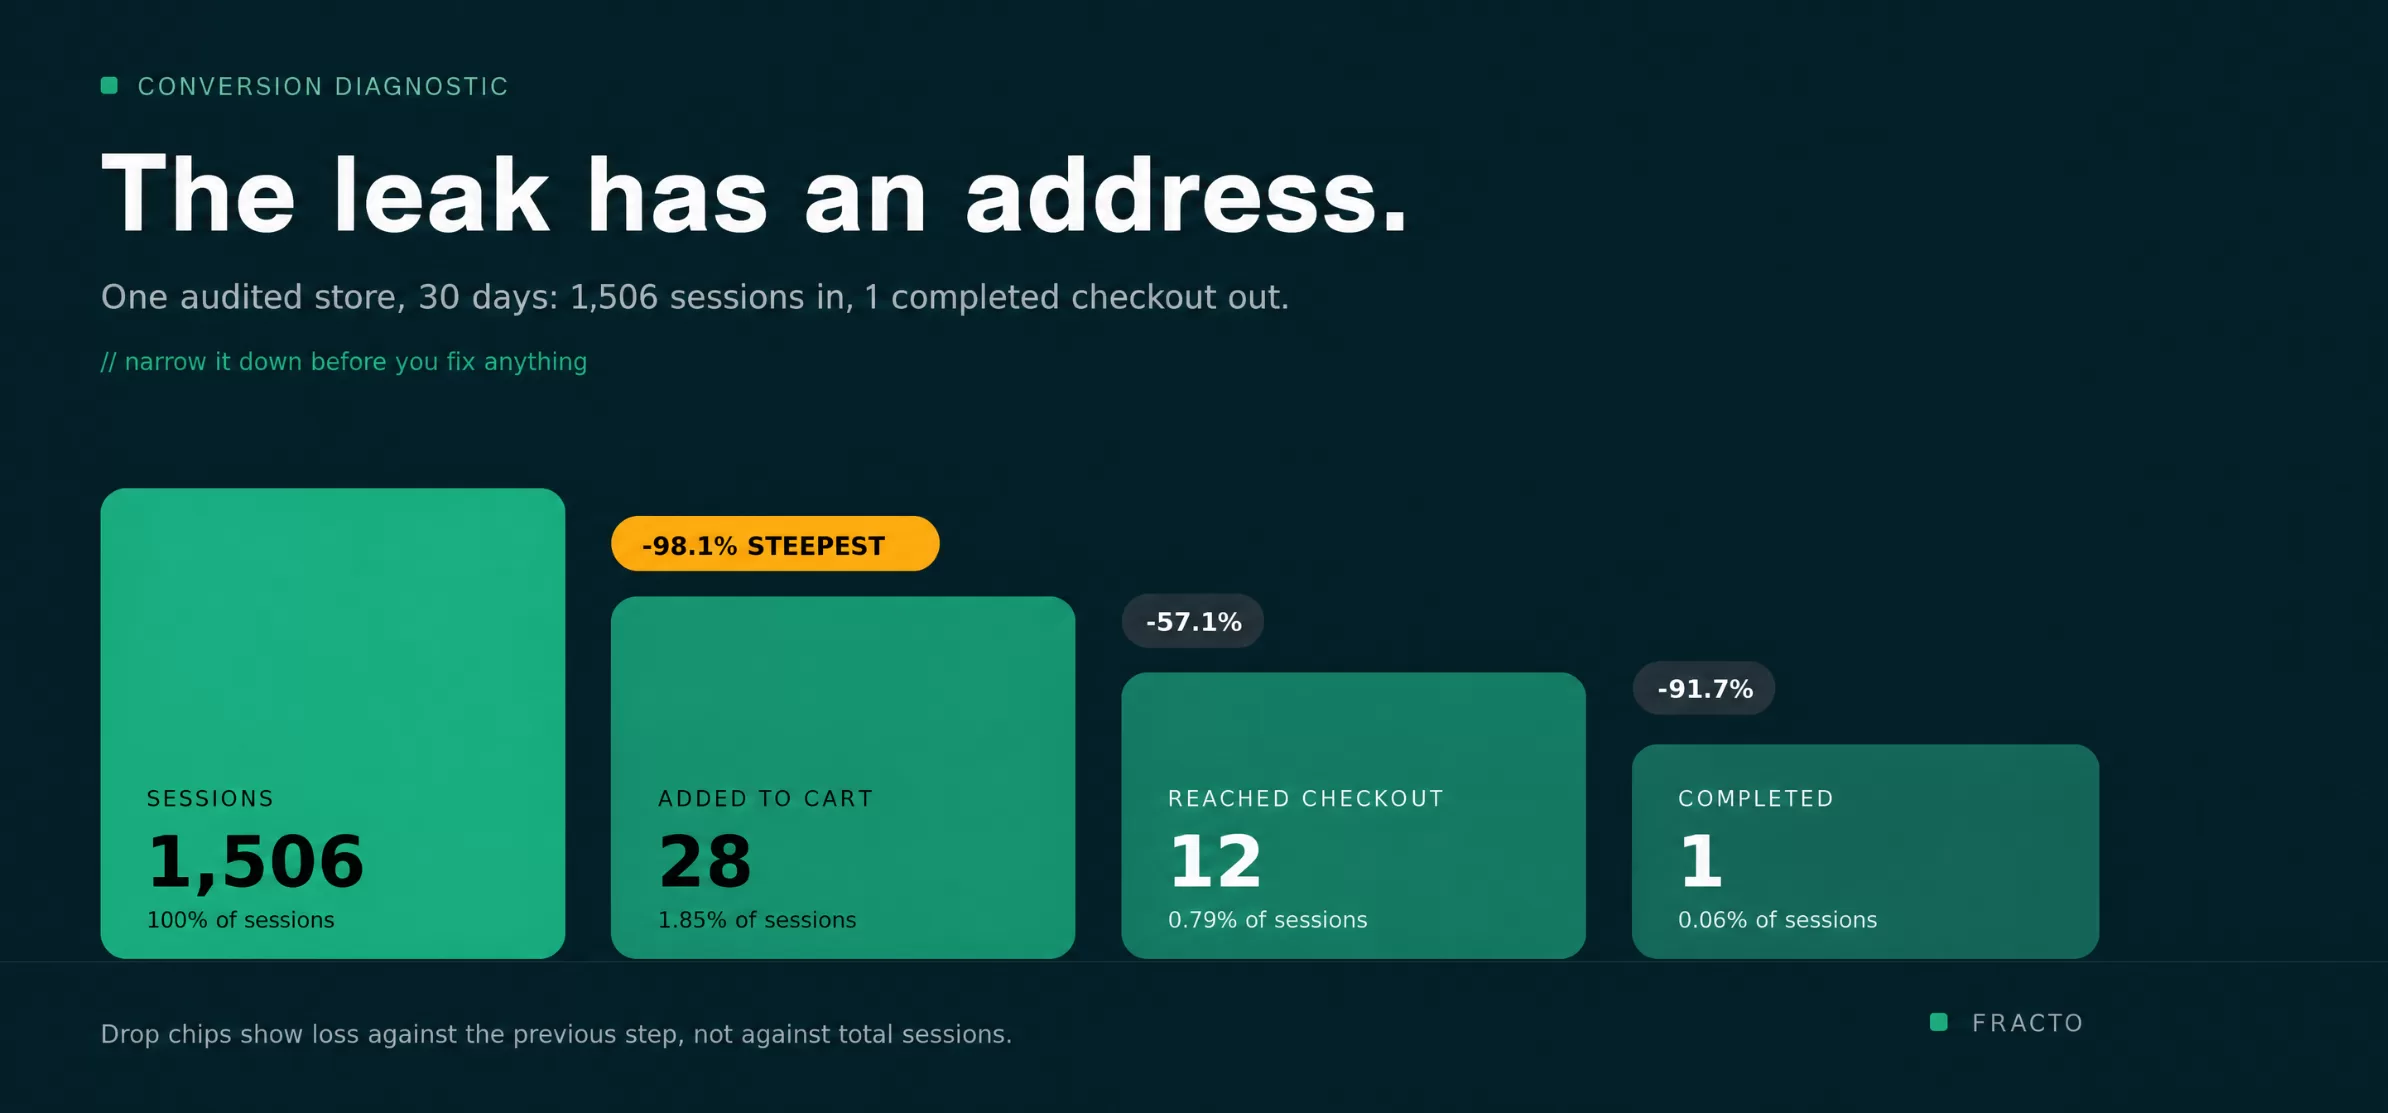
The short answer
If you are asking why is my website not converting, diagnose it by working the funnel in a fixed order: confirm tracking is accurate, segment traffic by source, watch session recordings of visitors who left, then read your checkout funnel to find the step with the steepest drop-off. Fix that step first, not everything at once.
Most stores skip diagnosis entirely. Something feels broken, so a redesign gets scheduled or the ad budget goes up. Both are expensive ways to guess.
The point of a diagnostic is narrowing. By the end of an afternoon you should be able to say “we lose most people between the product page and the cart” rather than “conversions are bad.” That one sentence tells you what to fix and, just as usefully, what to leave alone.
Looking for the underlying causes rather than the method? Start with why your Shopify store gets traffic but no sales. This piece is the how.
How do I identify what is stopping customers from buying?
Find the step where the most people disappear, then look at that step specifically rather than at the whole store.
Conversion problems feel vague because “my website isn’t converting” describes an outcome, not a location. Why is my website not converting is the right question, but the answer is always a place in the funnel rather than a single cause. Every store loses visitors at four points: landing on the site, viewing a product, adding to cart, and completing checkout. Your job is to work out which of those four leaks worst.
Order matters. Run the cheapest checks first, so you don’t spend a week on a redesign when the real problem was a broken pixel.
What Shopify analytics should I check to understand low sales?
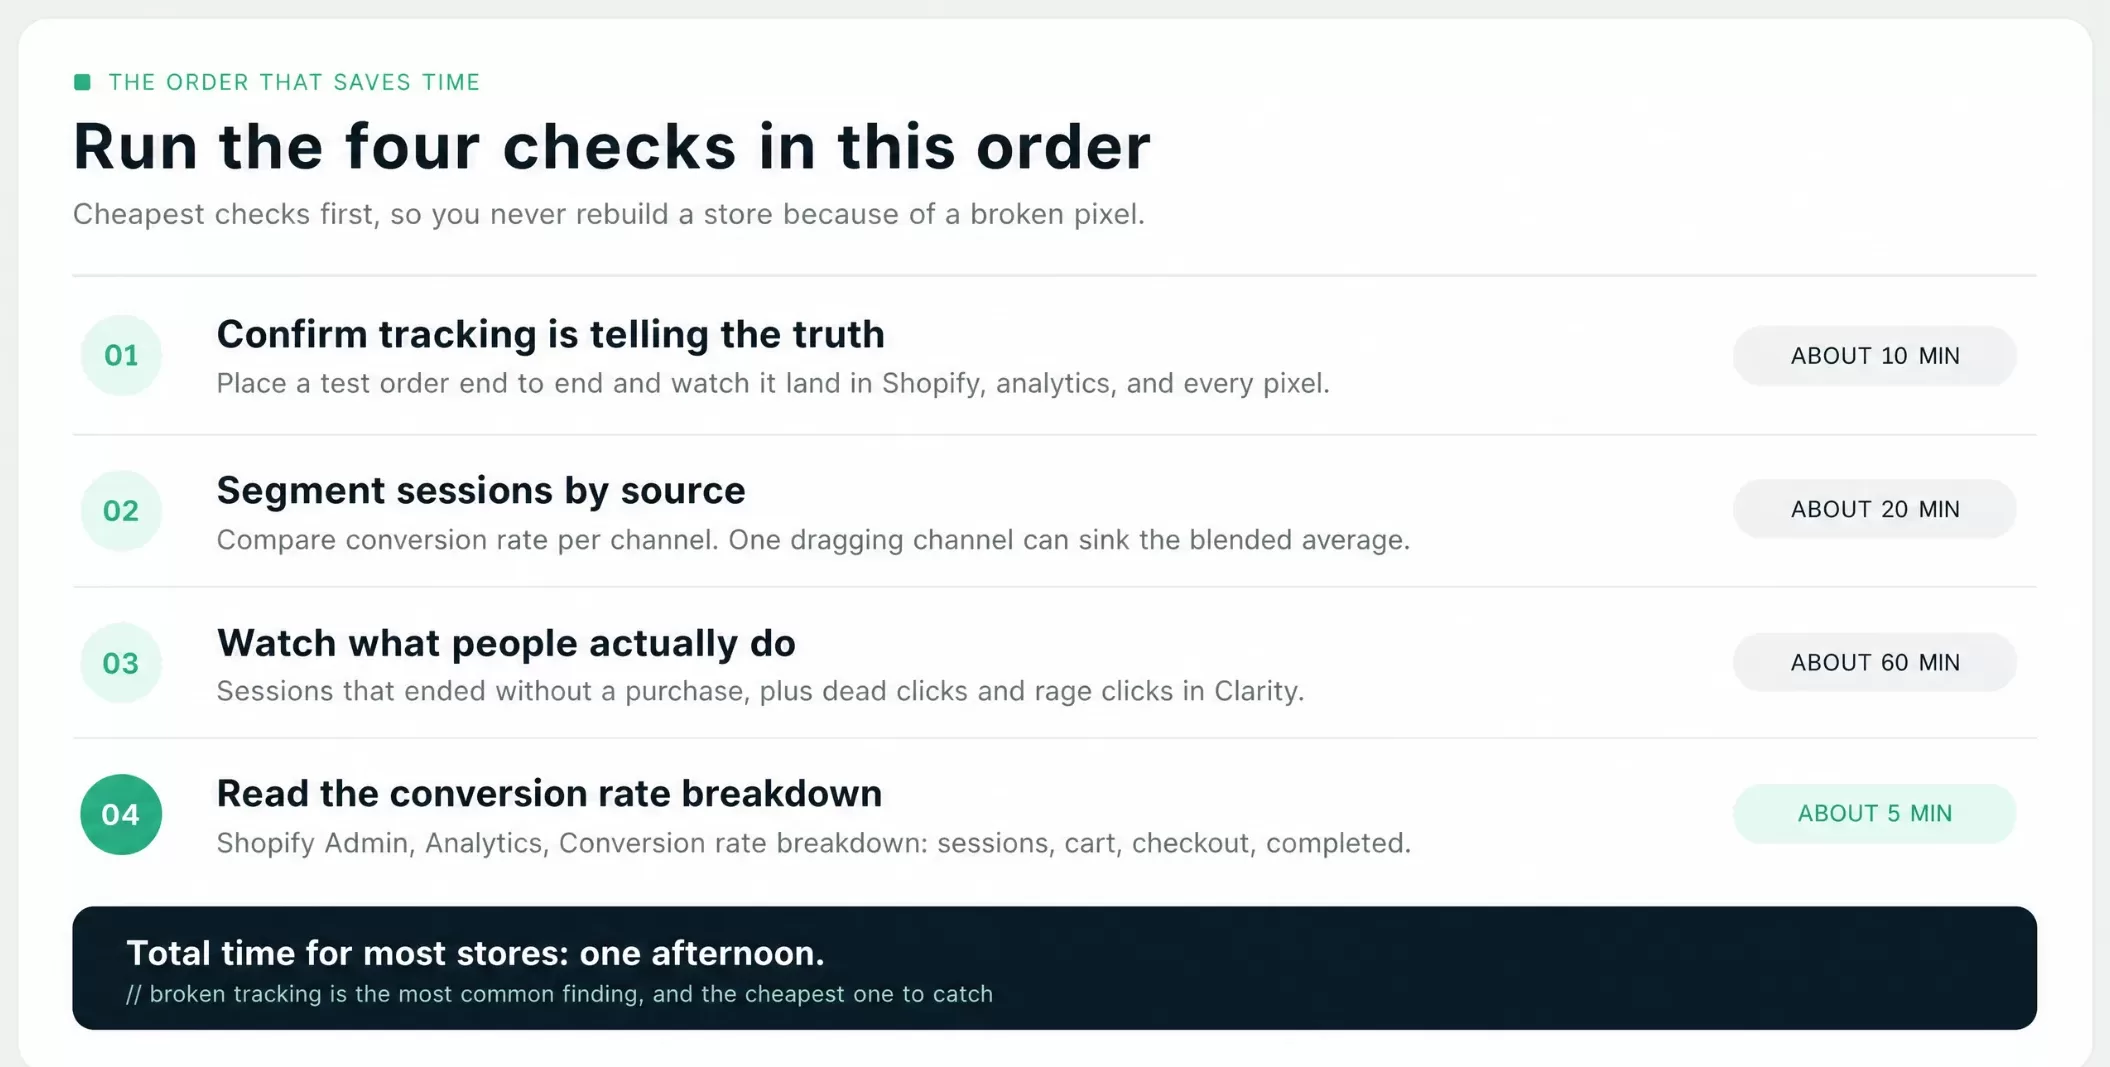
Four things, in this order: your tracking, your traffic sources, your behaviour recordings, then your checkout funnel.
-
Confirm tracking is telling the truth. Place a real test order end to end. Does it complete, appear in Shopify, and fire your analytics and pixels on the thank-you page?
This step catches more than people expect. Broken tracking is rarely a missing tag; it is usually something adjacent breaking it quietly. On one store we audited, a cookie-consent banner and a layout issue were between them preventing events from firing correctly, so the reporting understated real performance. Ten minutes of testing saves a week of fixing the wrong thing, which is why clean tracking comes before everything else. - Segment sessions by source.Compare conversion rate per channel rather than the blended average. If one channel is dragging the average down, you may have a traffic problem rather than a store problem.
- Watch what people actually do.Microsoft Clarity is free. Watch sessions that ended without a purchase, and check its Insights panel for dead clicks (people clicking things that do nothing) and quick backs (landing and leaving immediately). An hour of this usually reveals more than a week of dashboards.
- Read the conversion rate breakdown.In Shopify Admin, go to Analytics, then Conversion rate breakdown. It shows sessions, added to cart, reached checkout, and completed checkout as a single chain.
- What the session recordings surfaced
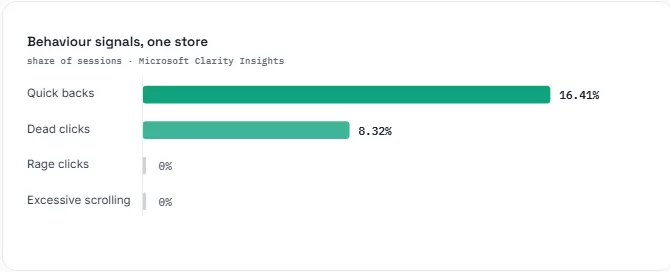
The two signals that mattered here: quick backs at 16.41% (roughly one in six visitors landed and bounced straight back out, usually an ad-to-page mismatch) and dead clicks at 8.32% (people clicking things that did nothing). Rage clicks and excessive scrolling were clean.
Why is my website not converting when traffic looks healthy?
Sometimes the funnel itself is fine, but the traffic coming to the store was never likely to convert. Segmenting traffic by source helps you understand the difference.
Open your analytics and compare the conversion rate for each channel instead of looking at the blended conversion rate. Visitors coming from a Google search for a specific product or service usually have higher purchase intent and are closer to making a decision. On the other hand, visitors coming from social media, blog posts, or broad awareness campaigns are often still exploring and may not be ready to buy.
This difference matters because it changes what “not converting” actually means. If most of your traffic comes from search and the conversion rate is still low, there may be a problem with the store or buying experience. But if most of your traffic comes from social media and other top-of-funnel channels, the issue may be the quality or intent of the traffic. In that case, rebuilding the product page may not solve the problem.
When reviewing your channel report, look at which sources have the highest bounce rates and shortest session durations, as these can indicate lower-intent visitors. Also check whether your paid campaigns are targeting specific audiences or using broad targeting, since loose targeting can increase traffic while lowering the overall conversion rate. Finally, check whether one large campaign is bringing in enough low-intent traffic to pull down your overall conversion rate.
Business owners often look at the blended conversion rate and assume it is a verdict on the store. But when you break the numbers down by traffic source, you may find that the real problem is not the funnel at all—it is the type of traffic entering it.
How do I read the conversion breakdown?
Read it left to right and find the biggest percentage gap between two adjacent steps. That gap is your leak.
- Shopify Analytics — Conversion rate breakdown
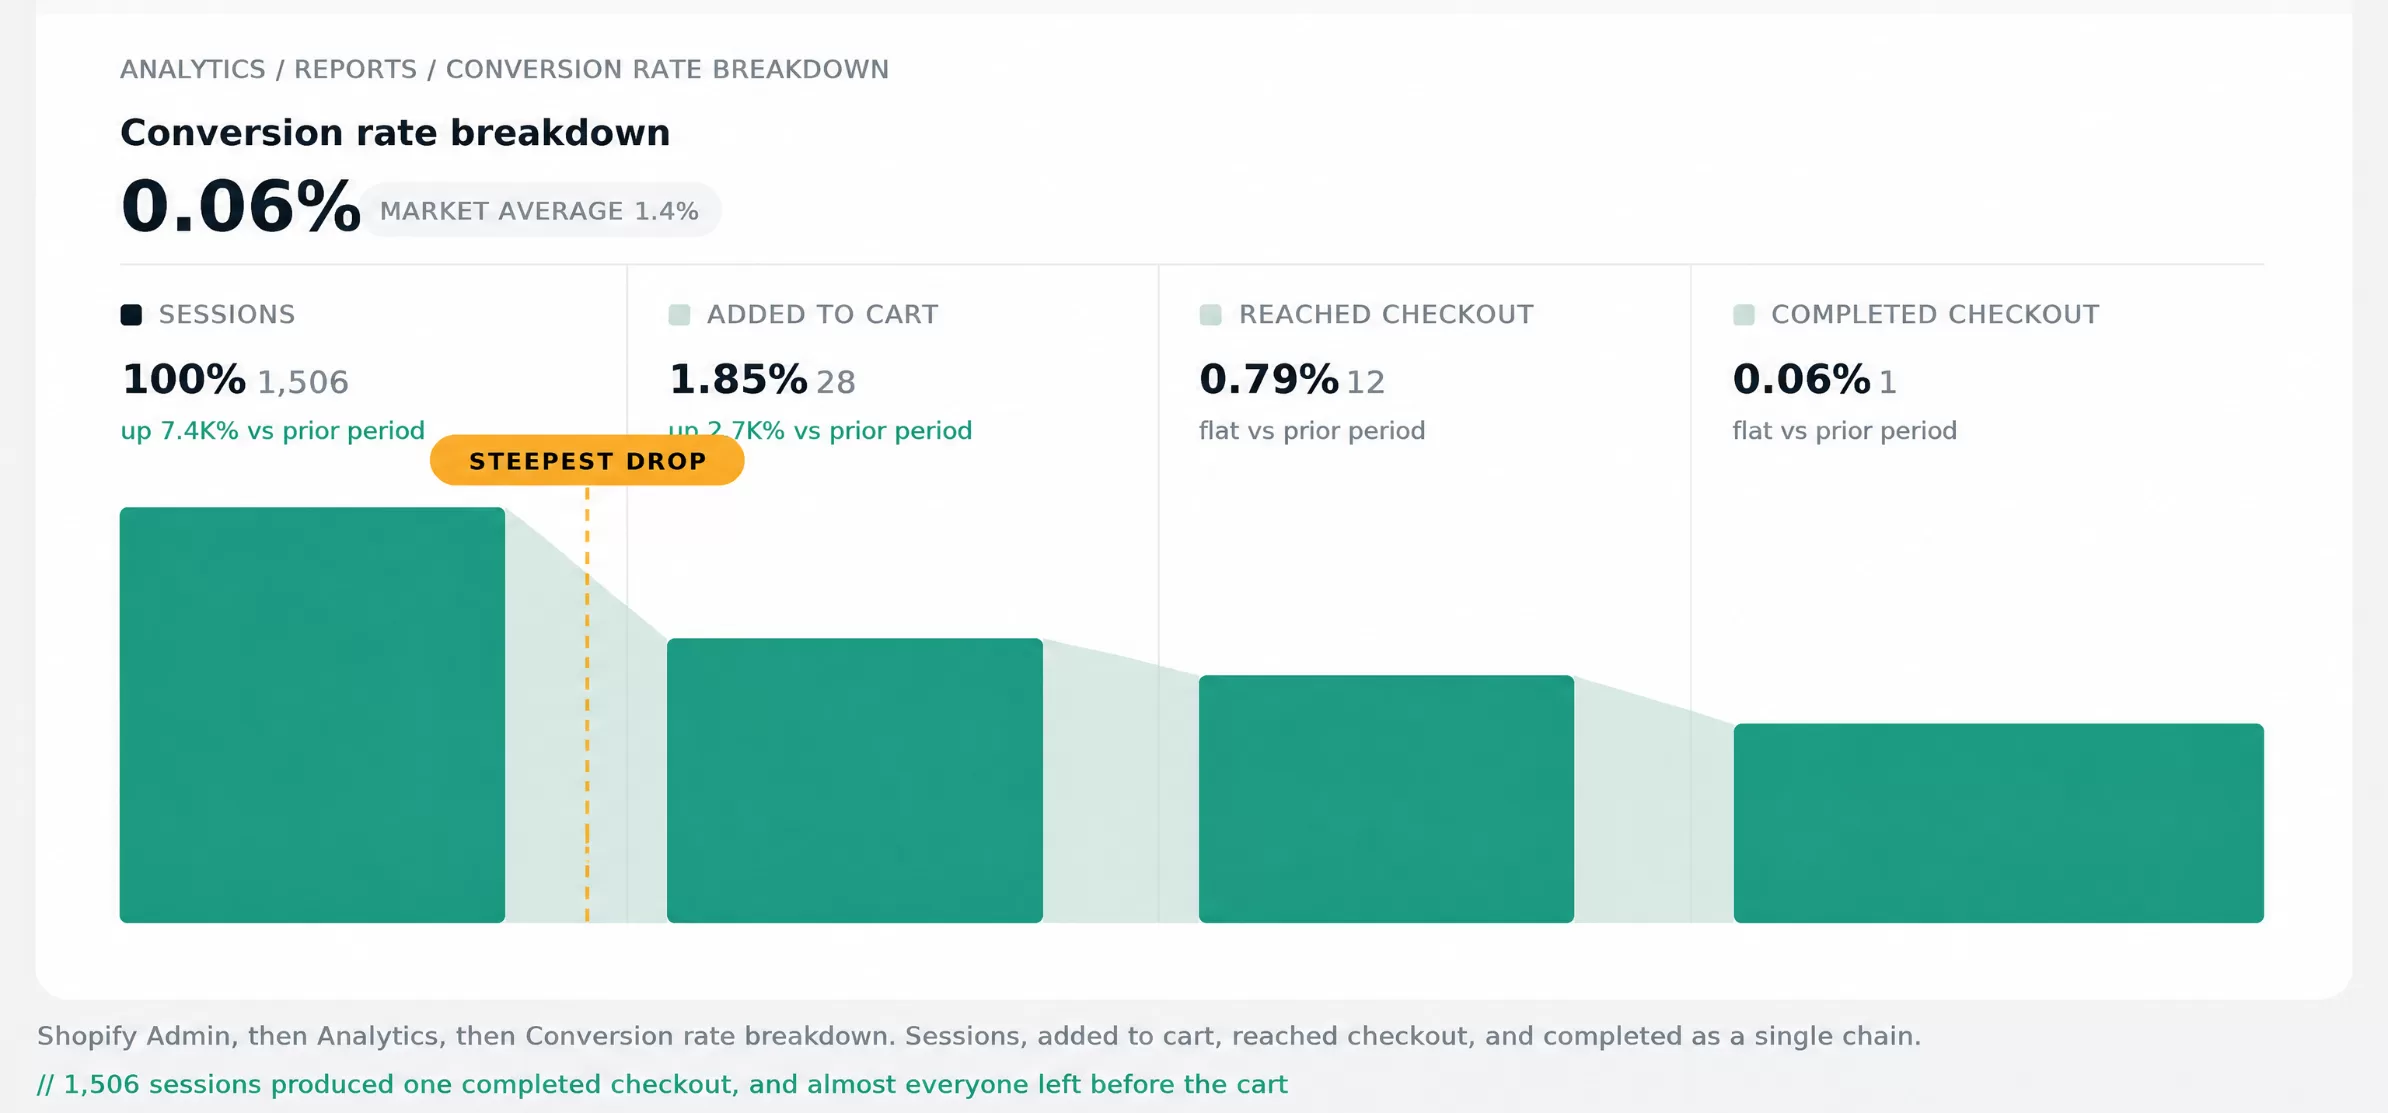
A real store we audited. 1,506 sessions produced a single completed checkout. Almost everyone left before the cart, so the leak is upstream on the product page or in the traffic, not in the checkout.
- Reading the drop-off
Where the drop is steepest
What it usually means
Where to look
Sessions to added-to-cart
Traffic quality, message match, or product page
Ad-to-page match, images, price clarity
Added-to-cart to reached-checkout
Cart friction or cost surprise
Shipping shown late, unclear totals, cart UX
Reached-checkout to completed
Payment, trust, or form friction
Forced accounts, form length, payment options
For context, the average Shopify store converts about 1.4% of sessions (Littledata, 2023 benchmark of 2,800 stores). Near that figure, you may have an opportunity rather than a fault. Near zero at real traffic volume, something concrete is broken.
How can I identify checkout issues causing lost sales?
Compare how many shoppers reach checkout against how many finish. If they arrive and stall, the problem is inside the checkout; if they never arrive, stop looking here and work upstream.
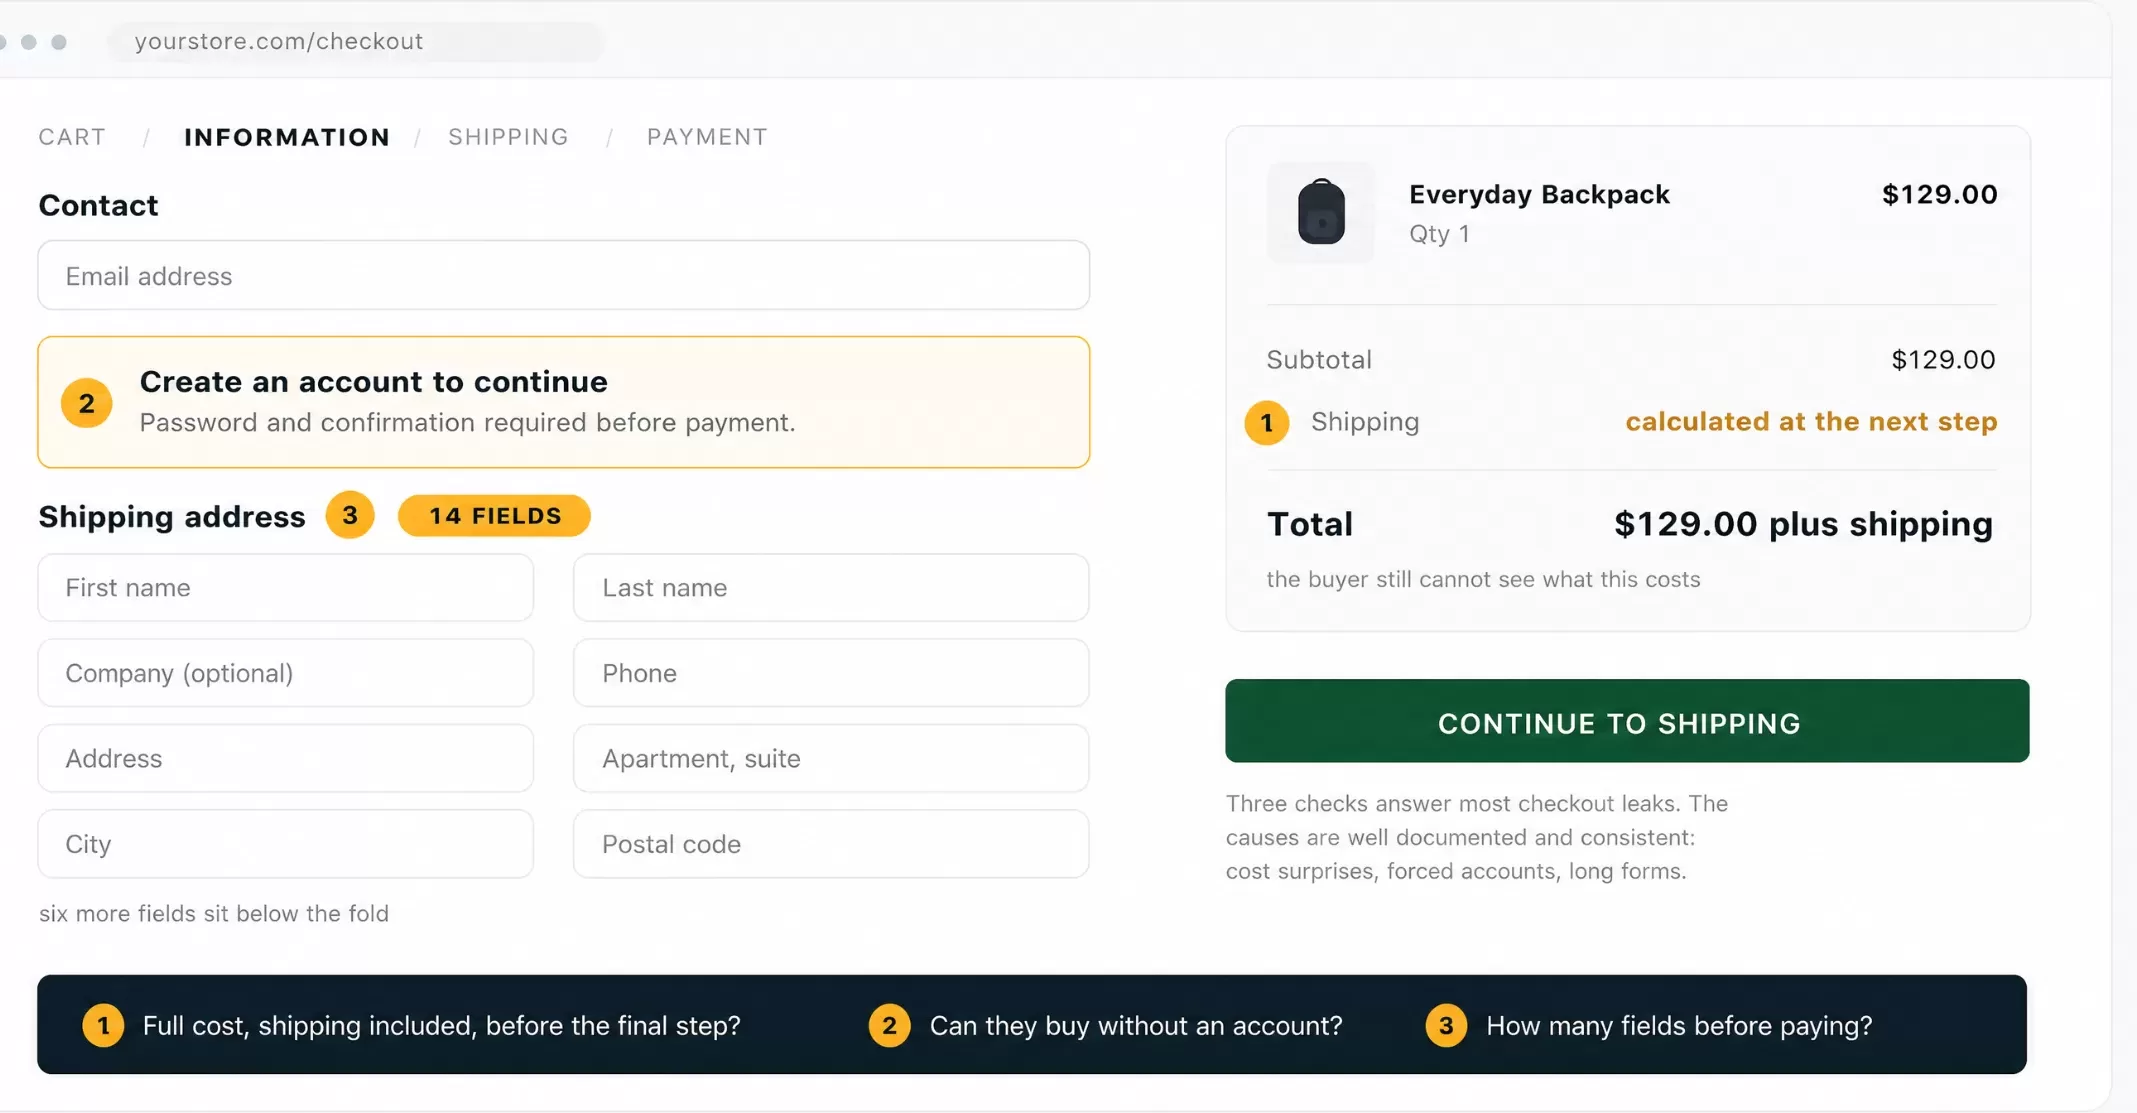
When the leak is inside checkout, the causes are well documented and consistent: cost surprises appearing late, forced account creation, and too many form fields. We cover the numbers and the fixes in detail in the pillar guide.
For the diagnostic itself, three questions are enough. Does the shopper see the full cost, shipping included, before the final screen? Can they buy without creating an account? How many fields stand between them and paying?
Check the user experience before you rebuild anything
If the traffic is right, the next question is whether the page gives visitors enough information and confidence to make a decision.
Start with loading times. Open the store on your own phone using mobile data instead of checking it only on a desktop preview. A slow page can make visitors leave before they even understand what the product offers. Next, check whether the page answers the questions shoppers are likely to have, such as sizing, materials, delivery, returns, and what happens if the product does not fit. If visitors have to leave the page to find these answers, there is a good chance they will simply leave the site.
Trust is another important factor. Reviews, a clear return policy, visible contact details, and secure payment messaging help first-time visitors feel comfortable enough to complete a purchase. When these trust signals are missing, customers rarely complain about them. They simply close the tab.
Then look at the call to action. On a long mobile page, a CTA that appears only after several screens of content can easily be missed. Similarly, if a button gives no visible feedback when tapped, users may think it is not working.
None of this necessarily requires a complete redesign. It requires looking at your own page from a stranger’s perspective and identifying every point where the experience leaves a question unanswered or creates doubt about making the purchase.
How do I fix a store with high traffic and low conversions?
Fix the single steepest drop-off, measure whether it moved, then run the diagnostic again.
Give each change enough time to show a real result rather than a good week. The next-biggest leak is then the one worth your attention. The discipline matters more than the tooling. A store that fixes one well-chosen problem at a time compounds. A store that changes everything at once learns nothing, because when the number moves nobody can say which change moved it.We find the leak, fix it, and prove the gain in your own numbers.
We audit your data, funnel, and channels to find where revenue is actually leaking, fix the biggest leaks first, then validate the lift in your own analytics rather than a vanity dashboard.
Frequently asked questions
How long does a proper conversion diagnostic take?
For most stores, an afternoon. Tracking verification takes about ten minutes, traffic segmentation another twenty, and an hour of session recordings usually surfaces the obvious friction.
Do I need paid tools to diagnose this?
No. Shopify Analytics, GA4, and Microsoft Clarity cover everything above and cost nothing. Paid testing tools matter later, when you are running experiments, not when you are locating the problem.
What if my traffic is too low to see a pattern?
A/B testing needs enough traffic and conversions to reach statistical significance, and as a rough guide most smaller stores will struggle to get there in a sensible timeframe. Diagnosis still works: session recordings and funnel drop-off tell you plenty without needing statistical power.
Should I fix the store or buy more traffic?
Why is my website not converting even though traffic is up?
Usually because the extra traffic is lower intent than what you had before, or because the leak sits downstream and more visitors simply means more people falling through the same gap. Segment by source before you change anything on the store.
Keep reading
Sources
Littledata, average Shopify conversion rate 1.4% (2023 benchmark of 2,800 Shopify stores) — littledata.io