Paid / ROAS
Average ROAS by Industry: 2026 Benchmarks
// context, not a target

By Fracto Solutions
September 25, 2026
The short answer
The average ecommerce ROAS in 2026 is commonly cited around 2.9x, with a median nearer 2x, but it varies widely by industry and channel: Google Ads tends to run higher (around 4x) than Meta prospecting (around 2.5x). Use these as directional context, your break-even ROAS matters more than any average.
~2.9x
~3.6x
Your
What's the average ROAS for ecommerce?
Commonly cited around 2.9x average, with a median nearer 2x, across 2026 sources. But averages hide big variation by industry, channel, and margin, and ROAS has been declining year over year as ad costs rise, so treat the headline number as a rough sanity check, not a goal.
The most-cited figure is an ecommerce average around 2.87x, with the median closer to 2.0x. Be precise about its date: this comes from full-year 2025 data, not 2026, even though many guides relabel it as current (the median is lower because a few high performers pull the average up). It’s worth knowing this number is drifting down, driven by rising ad costs, more competition, and privacy-related tracking losses, so year-over-year comparisons can look worse without anything actually breaking. But the bigger point is that a blended cross-industry average is only a loose reference. What “good” means for you depends on your industry, your channel mix, and above all your margin, which is why the pillar leads with break-even ROAS rather than any average.
What is the average ROAS by industry?
It varies widely. Higher-margin categories (beauty, supplements, fashion) tend to support and show stronger ROAS, while lower-margin ones (electronics, home) run lower. Here are directional 2026 ranges, benchmark against your own category, not the overall average.
Industry
Directional ROAS range (varies by source and channel)
Pet supplies
~3 to 5x
Fashion & apparel
~2.5 to 4.5x
Beauty & cosmetics
~2.3 to 4x
Food & beverage
~2.5 to 3.8x
Health & supplements
~2.5 to 3.5x
Home & furniture
~2 to 3.2x
Electronics
~2 to 2.8x
Ranges compiled across multiple 2026 ROAS benchmark sources; figures differ meaningfully between sources, so treat as directional and benchmark against your own category and margin.
The pattern to notice: the ranges are wide and overlapping, which is exactly why you shouldn’t anchor to a single figure. A number that’s excellent in electronics would be poor in beauty. Read your category, then read your margin.
How does ROAS differ by channel?
Significantly. Google Ads runs higher because search captures existing purchase intent, while Meta runs lower because it has to create demand. On the largest dataset available, Triple Whale’s roughly 35,000 ecommerce brands over full-year 2025, the medians are about 3.5x to 3.7x on Google and about 1.9x on Meta. Agency guides often quote 4 to 4.5x for Google and 2.2 to 2.8x for Meta; those are higher than the median and worth treating as the optimistic end rather than the norm. Retargeting on either platform runs higher than prospecting.
Channel is one of the biggest sources of ROAS variation, and understanding why prevents bad comparisons. Google search ROAS tends to be higher because you’re capturing people already searching for what you sell, high intent, easier to convert. Meta (and other paid social) prospecting ROAS tends to be lower because you’re interrupting people who weren’t looking, creating demand rather than capturing it, which is harder and shows up as a lower immediate return. This doesn’t make Meta worse; it’s doing a different, earlier job in the funnel, which is exactly why last-click attribution unfairly punishes it (covered in marketing attribution for ecommerce). Retargeting on any channel shows higher ROAS because it re-engages people who already showed interest. So compare like with like: Google search to Google search, Meta prospecting to Meta prospecting.
- ROAS by channel
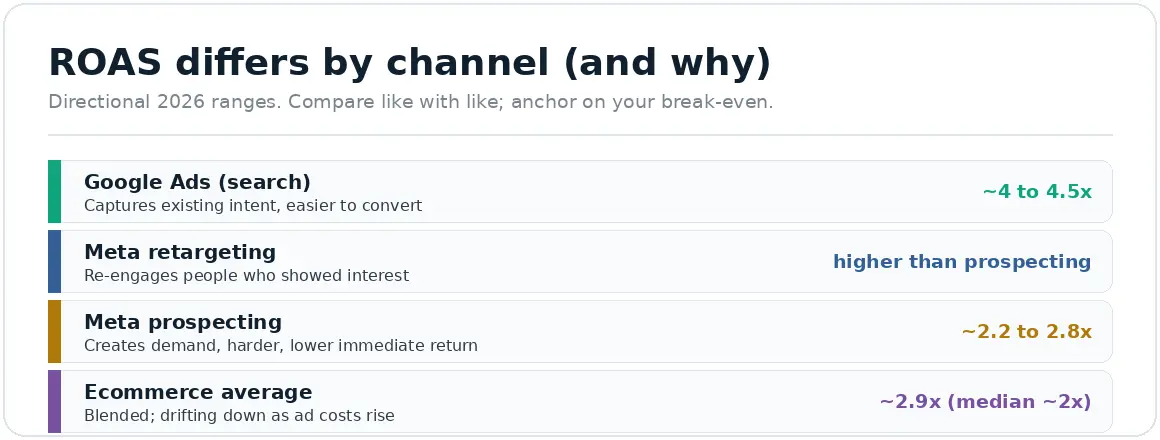
Directional 2026 ranges. Compare like with like; anchor on your break-even.
Why does my break-even ROAS matter more than the average?
Because the average tells you what others do; your break-even tells you whether you make money. A ROAS above the industry average can still lose you money if your margins are thin, and one below the average can be highly profitable if your margins are high.
This is the whole point of the cluster, and it’s worth repeating here because benchmark-hunting is so tempting. Your break-even ROAS equals 1 divided by your margin, and it’s the only line that separates profit from loss on ad spend. A 3x ROAS beats the electronics average but loses money at a 25 percent margin (which needs 4x to break even); a 2.5x ROAS is below many averages but is comfortably profitable at a 50 percent margin (which breaks even at 2x). So the industry average is useful only for rough context and spotting if you’re wildly off; the number that actually governs your decisions is your own break-even, covered in full in what is a good ROAS for ecommerce.
How should I use these benchmarks?
As a directional sanity check, not a target. Find your category and channel for rough context, note that sources disagree so no figure is exact, then set your actual target from your break-even ROAS and your own historical trend. Benchmark against yourself first.
The right way to use benchmarks: glance at your category and channel to confirm you’re in a sane range (if your ROAS is a fraction of everyone else’s, something’s likely wrong), then set your real target from your margin-based break-even and aim to beat your own past performance. Two cautions. First, sources genuinely disagree on the exact numbers, so don’t treat any single figure as precise. Second, seasonality moves ROAS substantially (Q4 and Q1 can differ a lot), so compare like periods. Benchmarks are a mirror for a quick sanity check; your break-even and your own trend are the compass. One more practical note: when you do compare to a benchmark, use the same attribution basis. Many published averages are platform-reported (and therefore inflated by double-counting), while your truest number is blended, real revenue over total spend. Comparing your honest blended ROAS against an inflated platform-reported average will make you look worse than you are, another reason to treat these figures loosely.
We benchmark you against your margin and category, not a blanket average.
We use industry and channel averages only as a rough sanity check, then set your real target from your break-even ROAS and your own historical trend, on blended, honestly-attributed numbers.
It’s part of our paid advertising work, grounded in the trustworthy analytics and tracking that makes any ROAS number believable.
// we would rather show up in your reporting than in your inbox
Frequently asked questions
What is the average ROAS for ecommerce in 2026?
Commonly cited around 2.9x average, with a median nearer 2x, across 2026 sources. It’s been declining year over year as ad costs rise. Treat it as a rough sanity check; your break-even ROAS (1 divided by your margin) matters far more for actual decisions.
Which industries have the highest ROAS?
Generally higher-margin categories like pet supplies, fashion, and beauty tend to show stronger ROAS, while lower-margin ones like electronics and home run lower. But ranges are wide and overlapping, and sources disagree, so benchmark against your own category and margin, not the overall average.
Why is Google ROAS higher than Meta ROAS?
Because Google search captures people already looking for what you sell (high intent, easier to convert), while Meta prospecting creates demand among people who weren’t searching (harder, lower immediate return). Meta isn’t worse; it does an earlier funnel job that last-click attribution tends to under-credit.
Should I aim for the industry average ROAS?
No. Aim above your own break-even ROAS, which depends on your margin, not the industry average. A ROAS above average can lose money at thin margins; one below average can profit at high margins. Use the average for context, your break-even for decisions.
Sources
Ecommerce average ROAS ~2.87x with a median near 2.0x, declining year over year. The underlying data is Triple Whale’s cohort of roughly 35,000 ecommerce brands for full-year 2025, together with Upcounting, and it is 2025 data, not 2026, although many guides relabel it as current. Channel medians from the same dataset: Google about 3.5x to 3.7x, Meta about 1.9x. We corrected the higher channel figures that appeared in an earlier draft (4 to 4.5x Google, 2.2 to 2.8x Meta); those come from agency estimates and sit above the median. https://coreppc.com/blog/average-roas-by-industry-2026/ ; https://hawky.ai/blog/roas-benchmarks-by-industry ; https://www.adbeacon.com/ecommerce-roas-benchmarks-by-industry/
Break-even ROAS = 1 ÷ margin (arithmetic); use blended real revenue / total spend, not platform-reported: see the ROAS pillar and attribution pillar.