Paid / ROAS
What Is a Good ROAS for Ecommerce?
// a good ROAS is the one that clears your break-even, not a number off a blog

By Fracto Solutions
September 24, 2026
The short answer
There’s no universal good ROAS. The benchmark that matters is your break-even ROAS, which equals 1 divided by your profit margin; good is anything comfortably above it. For context, the commonly cited ecommerce average is around 2.9x (median nearer 2x), but 4x can lose money at thin margins and 2x can profit at high ones.
1 / margin
~2.9x
Profit
What is ROAS, and how is it calculated?
ROAS (return on ad spend) is the revenue your ads generate divided by what you spent on them. Spend $10,000 and make $40,000 from those ads, and your ROAS is 4x (or 4:1). It measures ad efficiency, but on its own it says nothing about profit.
The formula is simple: ROAS equals ad revenue divided by ad spend, usually written as a multiple (4x) or a ratio (4:1). It answers “for every dollar I put into ads, how many came back in revenue?” The critical word is revenue, not profit. A 4x ROAS means $4 of revenue per $1 spent, but whether that’s good depends entirely on how much of those $4 you keep after the cost of goods, shipping, and fees. That gap between revenue and profit is why ROAS can’t be judged against a universal benchmark, and why the next section matters more than any average.
What is a good ROAS for ecommerce?
There’s no single good number, good is anything above your break-even ROAS. As a rough reference, the commonly cited ecommerce average is around 2.9x with a median nearer 2x, and a frequently quoted “4:1 rule” exists, but both are starting points, not targets. Your margin decides what’s actually good for you.
The honest answer frustrates people who want one number, but it’s the truth: “good” is relative to your economics. That said, here’s the context people are usually after, treat these as directional, since sources vary and figures shift year to year:
Reference point
Commonly cited figure
Ecommerce average ROAS
~2.9x (varies by source)
Ecommerce median ROAS
~2x
Popular "rule of thumb"
4:1 (a starting point, not a target)
Google Ads (higher, captures intent)
~4 to 4.5x
Meta Ads (prospecting)
~2.2 to 2.8x; retargeting higher
Averages compiled across multiple 2026 ROAS benchmark sources; figures vary and are directional. Benchmark against your own margin and category, not the global average.
How do I calculate my break-even ROAS?
The averages are useful only as a sanity check. The number that actually tells you whether your ads make money is your break-even ROAS, which is next.
Divide 1 by your profit margin (as a decimal). A brand with a 40 percent margin breaks even at 2.5x; a 25 percent margin needs 4x; a 70 percent margin breaks even below 1.5x. Anything above your break-even is profit; anything below is losing money on ads.
This is the single most important formula in paid advertising, and it’s just arithmetic: break-even ROAS = 1 ÷ your margin. Work it out with your gross (ideally contribution) margin and it tells you the exact line between profit and loss on ad spend:
Your profit margin
Break-even ROAS
20%
5.0x
30%
3.3x
40%
2.5x
50%
2.0x
70%
~1.4x
Break-even ROAS = 1 divided by margin. Pure arithmetic.
Now the “4:1 is good” myth falls apart: a 4x ROAS is highly profitable for the 70 percent margin brand and a money-loser for the 20 percent margin one. Same ROAS, opposite outcome, purely because of margin. Once you know your break-even, set a target comfortably above it (often 20 to 30 percent higher) to leave room for profit and error, and ignore the blanket benchmarks.
- Break-even ROAS by margin
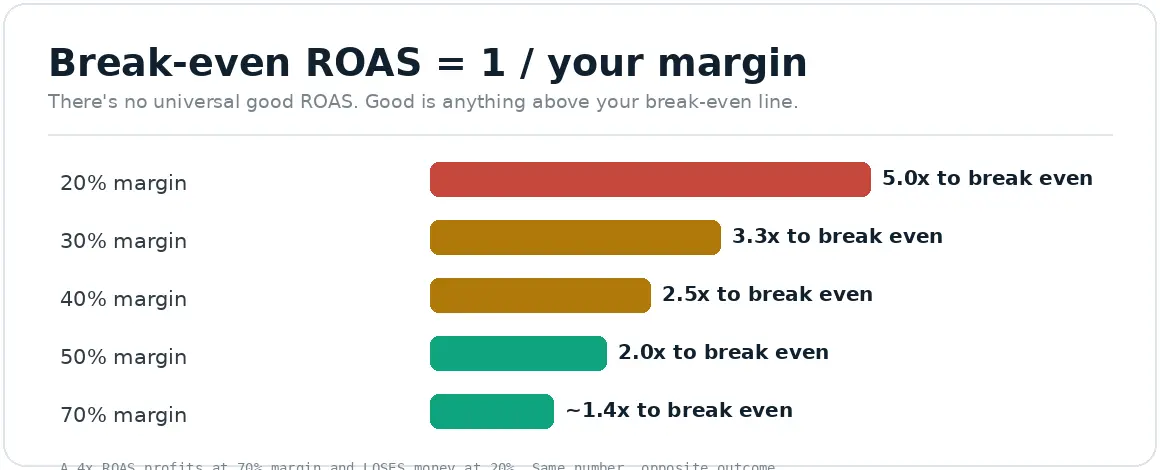
No universal good ROAS. Good is anything above your break-even line.
Why does margin matter more than the benchmark?
Because ROAS measures revenue, not profit, and your margin is what converts one into the other. A high-margin brand keeps most of each revenue dollar, so it profits at a low ROAS; a low-margin brand keeps little, so it needs a high ROAS just to break even. The benchmark ignores this entirely.
This is where blanket benchmarks do real damage. Two brands can run the identical 3x ROAS and have opposite fortunes: the 60 percent margin skincare brand is comfortably profitable, while the 25 percent margin electronics reseller is losing money on every sale. A “good ROAS is 4x” rule would tell the skincare brand to cut spend it should be scaling, and tell the electronics brand it’s fine when it’s underwater. That’s why margin, not the average, is the reference point. It also means improving your margin (or your conversion and AOV, which effectively do the same on the revenue side) lowers the ROAS you need, which is the deeper link to conversion work.
Should I always chase a higher ROAS?
No. A very high ROAS often means you’re under-spending, capturing only your easiest, cheapest customers and leaving profitable growth on the table. The goal is maximum profit, not maximum ROAS, and the two are not the same.
This is the counterintuitive part. It’s tempting to treat a rising ROAS as always good, but a sky-high ROAS usually signals timid spending: you’re only reaching the most ready-to-buy customers, where ads are cheap and efficient. Push spend higher and your ROAS will fall (you reach less certain buyers), but your total profit can still rise, because you’re acquiring more customers profitably. A brand obsessed with protecting a 6x ROAS may be leaving far more total profit unclaimed than a brand happily running 3x at scale. So above your break-even, the question isn’t “how high is my ROAS?” but “am I maximizing total profit?” This is the same tension between efficiency and growth covered in should you improve conversion or increase ad spend first.
How does ROAS relate to CAC?
They’re two views of the same paid-media reality: ROAS measures return per dollar of spend, CAC measures cost per customer acquired. Both depend on the same levers, and improving conversion or AOV helps both at once.
ROAS and customer acquisition cost (CAC) are siblings. ROAS looks at revenue efficiency (revenue per ad dollar); CAC looks at acquisition efficiency (dollars per new customer). They move together, and crucially, the same improvements lift both: raising your conversion rate means each ad click is more likely to buy, which improves ROAS and lowers CAC simultaneously. That’s why paid performance can’t be separated from what happens after the click, an efficient campaign sending traffic to a poorly converting site produces bad ROAS and high CAC no matter how well it’s managed. The economics of that connection are in how CRO lowers CAC for DTC brands, and the attribution behind trustworthy ROAS numbers is in marketing attribution for ecommerce.
Why is my reported ROAS higher than my real profit?
Because platform-reported ROAS double-counts and ignores costs. Meta and Google each claim credit for the same sale, inflating the total, and ROAS counts revenue, not the cost of goods, shipping, and fees. Your true picture is blended: real revenue divided by total spend, judged against margin.
Two things make dashboard ROAS look rosier than reality. First, attribution double-counting: each ad platform reports the same conversion in its own account, so the sum of platform-reported ROAS overstates real performance (covered in the attribution pillar). Second, ROAS is a revenue metric, it says nothing about the costs between revenue and profit. So a “great” 4x platform ROAS can still be unprofitable once you account for double-counting and margins. The fix is to judge blended ROAS (your actual Shopify revenue divided by total ad spend across all platforms) against your break-even. That single, honest number cuts through the platform optimism.
We set your target from your break-even, judge it on blended results, and optimize for profit.
Rather than chasing a benchmark, we calculate your break-even ROAS from your real margins, set a target comfortably above it, and measure performance on blended economics (actual revenue over total spend) rather than double-counted platform dashboards. Then we improve the levers that lift ROAS and lower CAC together, chiefly conversion and AOV.
It’s the same measurement-first discipline behind our paid advertising and conversion optimization work, because a conversion rate gain flows straight through to ROAS without you spending another rupee on traffic. It is the cheapest lever on the whole equation.
// we would rather show up in your reporting than in your inbox
Frequently asked questions
What is a good ROAS for ecommerce?
There’s no universal number, good is anything above your break-even ROAS (1 divided by your margin). For context, the commonly cited ecommerce average is around 2.9x with a median near 2x, and a “4:1 rule” is often quoted, but both are starting points. A 4x can lose money at thin margins and 2x can profit at high ones.
How do I calculate break-even ROAS?
Divide 1 by your profit margin as a decimal. A 40 percent margin brand breaks even at 2.5x (1 ÷ 0.40); a 25 percent margin needs 4x; a 70 percent margin breaks even below 1.5x. Set your target comfortably above your break-even to leave room for profit.
Is a higher ROAS always better?
No. A very high ROAS often means you’re under-spending and capturing only your easiest customers. Above break-even, the goal is maximum total profit, not maximum ROAS, and scaling spend at a lower (but still profitable) ROAS can produce more total profit than protecting a high one.
Why is my platform ROAS higher than my actual profit?
Two reasons: platforms double-count (Meta and Google both claim the same sale), and ROAS counts revenue, not profit (it ignores cost of goods, shipping, and fees). Judge blended ROAS, your real Shopify revenue over total ad spend, against your break-even margin.
What's a good ROAS on Meta vs Google?
Google tends to run higher because search captures existing intent, while Meta runs lower because it creates demand, with retargeting higher than prospecting. On Triple Whale’s roughly 35,000-brand dataset for full-year 2025 the medians are about 3.5x to 3.7x on Google and about 1.9x on Meta; agency guides commonly quote higher figures, so treat those as the optimistic end. But these vary by source and niche, so anchor on your own break-even, not the channel average.
Sources
Break-even ROAS = 1 ÷ margin (arithmetic); commonly cited ecommerce average ~2.87x with a median near 2.0x, and “4:1” as a rule-of-thumb starting point. The underlying data is Triple Whale’s cohort of roughly 35,000 ecommerce brands for full-year 2025, together with Upcounting, so it is 2025 data rather than 2026 despite how it is usually labelled. Channel medians from that dataset are about 3.5x to 3.7x on Google and about 1.9x on Meta; we corrected higher figures that appeared in an earlier draft because they came from agency estimates rather than the median. https://www.adbeacon.com/ecommerce-roas-benchmarks-by-industry/ ; https://www.nvecta.com/blog/what-is-a-good-roas/ ; https://www.usedaymark.io/blog/what-is-a-good-roas ; https://hawky.ai/blog/roas-benchmarks-by-industry
Platform-reported ROAS double-counts; use blended (real revenue / total spend): see the attribution pillar and its sources.
ROAS declining YoY (rising CPMs, competition, privacy): https://hawky.ai/blog/average-roas-ecommerce-benchmarks