Strategy / Growth
Ecommerce KPIs That Actually Matter
// track the numbers that drive decisions

By Fracto Solutions
September 15, 2026
The short answer
The ecommerce KPIs that actually matter tie to revenue and unit economics: revenue per visitor, conversion rate, average order value, customer acquisition cost, lifetime value, the LTV:CAC ratio, and repeat purchase rate. Track these against your own trend, and treat vanity metrics like raw traffic or social followers as context, not goals.
RPV
Money
Fewer
What makes a KPI actually matter?
A KPI matters if it connects to revenue or profit and can drive a decision. If a metric goes up and you can’t say whether you made more money, or what you’d do differently, it’s a vanity metric, not a KPI.
The test for any metric is simple: does it tie to money, and does it change what you do? Raw traffic fails the first test (more visitors who don’t buy is just a bigger bill). Social followers fail both. By contrast, revenue per visitor, CAC, and LTV all connect directly to whether the business makes money and all inform real decisions (where to spend, what to fix, whether to scale). The goal isn’t a bigger dashboard, it’s a smaller one focused on metrics that pass both tests. Everything else is context at best and distraction at worst. This matters more than it sounds, because dashboards tend to grow, not shrink: every tool adds its own metrics, and it’s easy to end up watching forty numbers and acting on none. A tight KPI set forces the opposite habit, fewer numbers, each one attached to a decision, reviewed often enough to actually change what you do.
What are the core ecommerce KPIs?
A focused set: revenue per visitor, conversion rate, average order value, customer acquisition cost, customer lifetime value, the LTV:CAC ratio, and repeat purchase rate. Together these cover getting traffic, converting it, growing orders, and keeping customers.
Here’s the core set and what each tells you:
KPI
What it tells you
Ties to
Revenue per visitor
Whether traffic actually produces revenue
Conversion x AOV
Conversion rate
Share of visitors who buy
Conversion lever
Average order value (AOV)
How much each order is worth
AOV lever
Customer acquisition cost (CAC)
What it costs to win a customer
Traffic efficiency
Customer lifetime value (LTV)
Total value of a customer over time
Retention x AOV
LTV:CAC ratio
Whether acquisition is sustainable
Unit economics
Repeat purchase rate
Share of customers who buy again
Frequency lever
*The core KPI set maps to the four growth levers (traffic, conversion, AOV, frequency); consistent across 2026 metric frameworks.*
Notice each maps to a growth lever, that’s not a coincidence, the KPIs that matter are the ones that measure the levers that drive revenue.
- KPIs vs vanity metrics
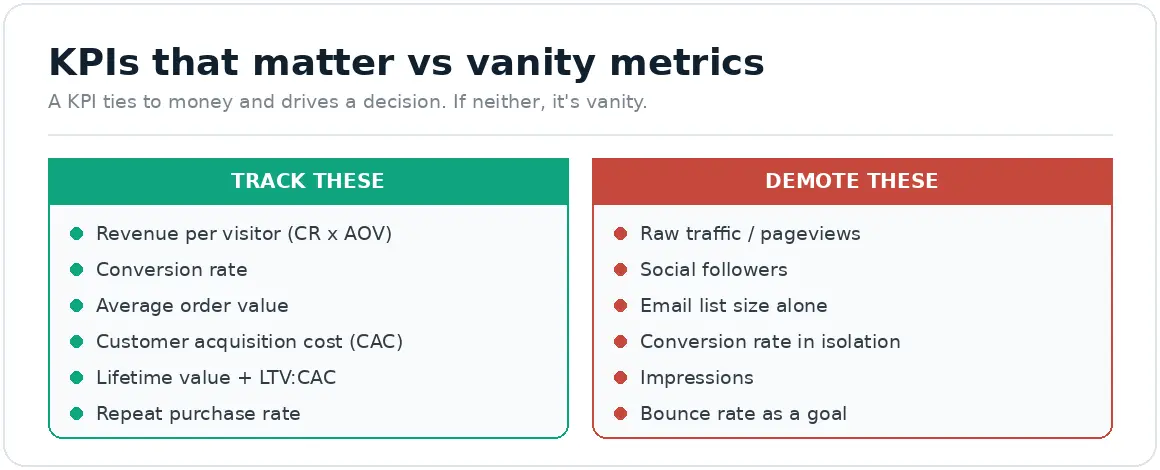
A KPI ties to money and drives a decision. If neither, it is vanity.
Why is revenue per visitor the metric to lead with?
Because it combines conversion and order value into one honest number that reflects actual revenue, and it can’t be gamed the way raw conversion rate can. A low-conversion, high-AOV store can out-earn a high-conversion, low-AOV one.
Revenue per visitor (conversion rate times AOV) is the single most useful headline metric because it resists the classic trap of optimizing one thing while breaking another. Chase conversion rate alone and you might discount your way to more orders while destroying margin, conversion up, profit down. Revenue per visitor catches that, because the AOV drop shows up. It’s why sophisticated stores treat it as their north star rather than raw conversion rate. Lead with revenue per visitor, then use conversion rate and AOV underneath it to see which half is moving.
Which metrics are vanity metrics to ignore?
Metrics that go up without telling you whether you made money: raw traffic and pageviews, social followers, email list size alone, and even raw conversion rate in isolation. They’re context, not goals, don’t optimize for them directly.
Vanity metrics aren’t useless, they’re just misleading as goals. Raw traffic matters only if it converts; chasing visitor count can mean buying junk traffic that looks like growth and isn’t. Social followers and email list size are worth watching as reach, but a big list that doesn’t buy is not revenue. Even conversion rate, a real KPI, becomes a vanity trap when optimized in isolation (you can lift it while shrinking revenue). The fix isn’t to stop looking at these, it’s to demote them: treat them as context that helps explain the money metrics, never as the target you optimize toward. A simple discipline helps here: for every metric on your dashboard, write next to it the decision it would change. The ones where you can’t name a decision are the ones to move off the main view. What’s left is a dashboard that actually runs the business rather than just describing it.
How do I actually use these KPIs?
Track them against your own trend, segment where it matters, and use them to find your weakest growth lever, then act on that. KPIs are a diagnostic tool for deciding where to focus, not a scoreboard to admire.
The point of KPIs is decisions, so use them as a diagnostic loop: – Benchmark against yourself. Your month-over-month trend matters more than a cross-industry average, especially for metrics that vary a lot by category (like conversion and repeat rate). – Segment. Split key metrics by device, traffic source, and new-versus-returning; blended numbers hide where the real problem is. – Find the weakest lever. Use the KPI set to see which of the four growth levers is lagging (the core of growth-strategy diagnosis). – Act, then re-measure. Fix the constraint, confirm the KPI moved, then move to the next.
And underpinning all of it: the numbers have to be right. If your tracking is broken, your KPIs lie, which is why measurement quality comes first (see seven signs your analytics setup is broken).
We build you a tight KPI set tied to revenue, on trustworthy data.
We cut the dashboard down to the metrics that actually drive decisions, revenue per visitor, CAC, LTV, repeat rate, and make sure the tracking behind them is accurate, because a KPI built on broken data just misleads you confidently.
It’s part of our analytics and tracking work, feeding the conversion optimization decisions those numbers should drive.
Frequently asked questions
What are the most important ecommerce KPIs?
The ones tied to revenue and unit economics: revenue per visitor, conversion rate, average order value, customer acquisition cost, lifetime value, the LTV:CAC ratio, and repeat purchase rate. Together they measure the four levers of growth, getting traffic, converting it, growing orders, and keeping customers.
What is the single best ecommerce metric?
Revenue per visitor (conversion rate times AOV). It combines two levers into one honest number, reflects actual revenue, and can’t be gamed the way raw conversion rate can. A low-conversion, high-AOV store can out-earn a high-conversion, low-AOV one, revenue per visitor captures that.
What are vanity metrics in ecommerce?
Metrics that rise without telling you whether you made money: raw traffic and pageviews, social followers, email list size on its own, and conversion rate optimized in isolation. They’re useful as context but misleading as goals, don’t optimize directly for them.
How often should I review my KPIs?
Sources
The “Big Five” / core ecommerce KPI set (AOV, conversion rate, traffic, LTV, retention)
and revenue-per-visitor as a truer north star: consistent across 2026 metric frameworks.
BigCommerce – Ecommerce Metrics;
DRIP – Good Ecommerce Conversion Rate
KPIs map to the four growth levers (traffic, conversion, AOV, frequency)/
Shopify – Ecommerce Revenue Growth