Retention / Benchmark
What Is a Good Repeat Purchase Rate for Ecommerce?
// good depends entirely on what you sell

By Fracto Solutions
September 12, 2026
The short answer
A good repeat purchase rate for ecommerce is around 25 to 30 percent, with 15 to 30 percent being the typical range. But it varies enormously by category: consumables like supplements and food reach 30 to 45 percent, while durables like electronics sit at 10 to 20 percent. Benchmark against your own category.
25-30%
considered a strong repeat purchase rate
~3×
gap between best (consumables) and worst (durables)
Your
own category and trend beat any global average
What counts as a good repeat purchase rate?
Around 25 to 30 percent is generally considered strong, and 15 to 30 percent is the typical range for most ecommerce stores. Below 15 percent suggests weak retention; above 30 percent is good for most categories, and very good for durables.
Repeat purchase rate is the share of your customers who have bought more than once. Across multiple 2026 benchmark analyses, the numbers converge on a consistent picture: the typical store sits in the 15 to 30 percent range, and 25 to 30 percent is the mark of strong retention. But, and this is the crucial caveat, that “average” hides enormous variation by category. A single cross-industry number is close to meaningless on its own; what makes it useful is comparing it to your category and, even more, to your own past performance. Treat any published figure as directional, not a hard target.
How do repeat purchase rates vary by category?
Enormously. Consumable and replenishment categories retain far better than durables, because people simply need to rebuy them. The gap between the best and worst categories is roughly 3x.
Here’s the honest benchmark picture, compiled across 2026 sources as directional ranges:
Category
Typical repeat purchase rate
Supplements & wellness
30 to 45%
Food & beverage
28 to 40%
Beauty & personal care
25 to 35%
Apparel & fashion
20 to 30%
Home & furniture
15 to 25%
Electronics
10 to 20%
Source: ranges compiled from multiple 2026 retention analyses (Shopify, Klaviyo, Yotpo cohort data and others). Sources vary; use as directional.
The logic is purchase frequency. Supplements get reordered every month or two, so a high repeat rate is structural. A sofa is bought once every several years, so a low repeat rate isn’t a failure, it’s the nature of the category. This is why a supplements brand at 20 percent should worry while a furniture store at 20 percent is doing well. Always read your rate against your category, not the global average.
- Repeat rate by category
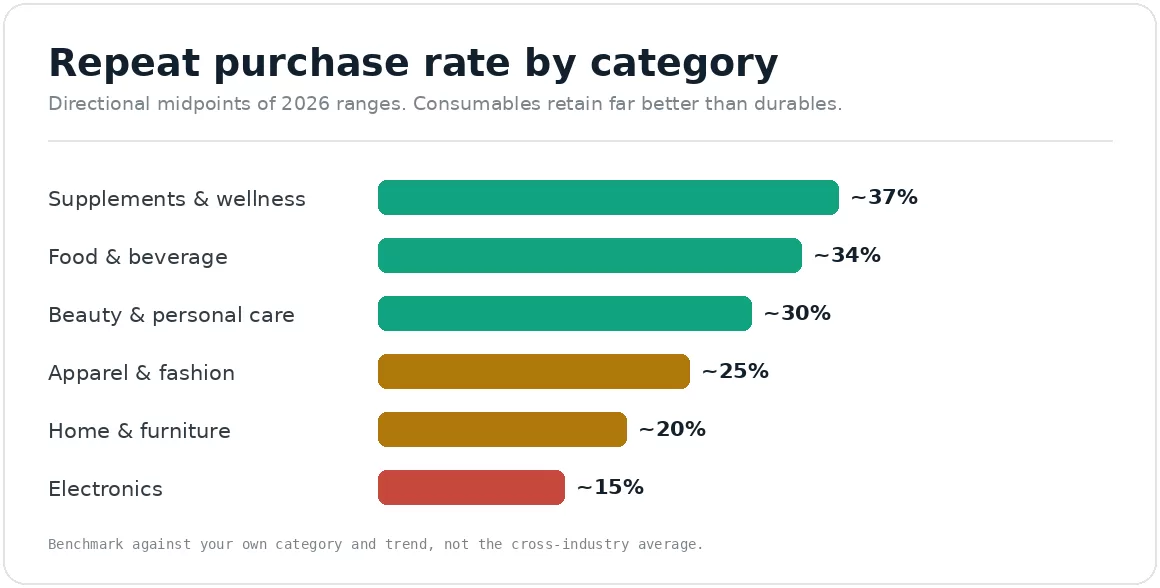
Directional midpoints of 2026 ranges. Benchmark against your own category, not the average.
How do I calculate my repeat purchase rate?
Divide the number of customers who have made more than one purchase by your total number of customers, over a defined period. That percentage is your repeat purchase rate.
The formula is simple: repeat purchase rate equals customers with more than one order, divided by total customers, times 100. If 250 of your last 1,000 customers came back for a second order, your rate is 25 percent. A few things to keep it accurate: define a consistent time window (so you’re comparing like with like over time), decide whether you’re measuring lifetime or a cohort period, and exclude test or wholesale orders that would distort it. Shopify and most analytics tools can surface this, but knowing the formula means you can sanity-check what they report.
What's the difference between repeat purchase rate and retention rate?
Repeat purchase rate is the share of all customers who’ve bought more than once (a cumulative, lifetime view). Retention rate is the share of a specific cohort who return within a set window (a time-bound view). They answer different questions.
The two get used interchangeably, but they’re not the same. Repeat purchase rate is a simple lifetime measure: of everyone who’s ever bought, how many bought again? Retention rate is cohort-based: of the customers acquired in, say, January, how many came back within 12 months? Retention rate is better for spotting whether your retention is improving over time, because it isolates each cohort; repeat purchase rate is simpler and good for a headline read. Track both if you can, but if you only track one for trend-spotting, make it cohort retention.
Why does my own trend matter more than the benchmark?
Because the category ranges are wide and your business is specific. A published benchmark tells you roughly where you stand; your own month-over-month trend tells you whether you’re actually getting better, which is what counts.
This is the most important point in the whole article. Published benchmarks are useful for a rough sanity check, but they’re built from wildly varied stores, so landing “above average” or “below average” says little. What actually matters is direction: is your repeat rate rising or falling over time, on consistent cohorts? A store improving from 18 to 24 percent is winning, even if it’s still below some benchmark; a store drifting from 32 to 26 percent is in trouble, even if it’s still “above average.” Watch the trend, and watch for the treadmill signal, revenue growing while repeat rate falls, which means you’re buying growth rather than building loyalty.
There’s a second reason to hold benchmarks loosely, and it catches out a lot of brands: published figures are measured over different windows, and almost none of them say so. A February 2026 analysis of over 156,000 DTC customers put the aggregate repeat purchase rate at 18.8% on a strict 365-day cohort, while the aggregators quoting 25 to 30% are typically using looser or lifetime definitions. Those two numbers aren’t contradicting each other; they’re answering different questions. So before you conclude you’re behind, check which window the benchmark used, and make sure yours matches. A lifetime repeat rate compared against a 90-day published figure will always flatter you, and a 365-day cohort compared against a lifetime figure will always alarm you.
How do I improve a low repeat purchase rate?
Start with the post-purchase experience and reordering. For most stores the fastest gains come from a strong post-purchase email sequence and making the next purchase effortless, especially for consumables.
If your rate is low for your category, the usual culprits are a weak or missing post-purchase experience and friction in reordering. The highest-leverage fixes: build a proper post-purchase email sequence (onboarding, then well-timed reorder prompts), offer replenishment or subscription options for consumables, and make sure the core experience (delivery, product, support) actually earns a second order. The full playbook is in how to improve ecommerce customer retention, and the email engine specifically in email and lifecycle marketing.
We benchmark you against your category and your own trend, then lift it.
We calculate your repeat purchase rate and cohort retention on consistent windows, compare them to your category rather than a misleading cross-industry average, and improve the weakest link, usually the post-purchase experience or reordering.
It’s part of our conversion optimization work, measured in your own analytics so the trend is real, not a vanity number.
Frequently asked questions
What is the average repeat purchase rate for ecommerce?
Typically 15 to 30 percent, with 25 to 30 percent considered strong. But it varies dramatically by category, so the average is only a rough guide. Consumables run much higher than durables. Benchmark against your own category and trend.
Is a 20 percent repeat purchase rate good?
It depends entirely on your category. For electronics or furniture, 20 percent is solid. For supplements or food and beverage, where 30 to 45 percent is normal, 20 percent would signal a retention problem. Context is everything.
How is repeat purchase rate calculated?
Divide the number of customers with more than one purchase by your total customers over a period, then multiply by 100. For example, 250 repeat customers out of 1,000 total is a 25 percent repeat purchase rate. Use a consistent time window.
Should I track repeat purchase rate or retention rate?
Both if possible. Repeat purchase rate is a simple lifetime measure; cohort retention rate better shows whether retention is improving over time. For spotting trends, cohort retention is more revealing; for a quick headline, repeat purchase rate works.
Keep reading
Sources
Repeat purchase rate typical 15 to 30% (25 to 30% strong), with strong category variation (supplements/food 30 to 45%, electronics 10 to 20%): compiled across multiple 2026 analyses. Measurement window materially changes the number: a February 2026 analysis of over 156,000 DTC customers reports 18.8% on a strict 365-day cohort, against the 25 to 30% commonly quoted on looser or lifetime definitions. https://churnmiser.com/blog/customer-retention kpis benchmarks ;
https://www.mageloyalty.com/blog/ecommerce-retention-benchmarks-by-industry-2026 data ;
https://www.opensend.com/post/repeatpurchase-rate-ecommerce
Repeat purchase rate vs retention rate definitions: https://www.trylexsis.com/blogs/ecommerce-retention-rate-benchmarks-2026