Shopify CRO Checklist: Fixing Low Conversions
// the usual suspects, and how to fix them
The short answer
Low Shopify conversion usually comes down to a short list of fixable issues: a slow or confusing product page, hidden costs or forced accounts at checkout, a clunky mobile experience, slow load times, and missing trust signals. Work through them in order of impact, starting with checkout and mobile, where most sales are lost.
If your store gets traffic but few sales, the cause is rarely mysterious, it is almost always one or two items on a familiar list. This checklist walks through the usual culprits, grouped by where they live in the buying path.
Which problems actually cost the most sales?
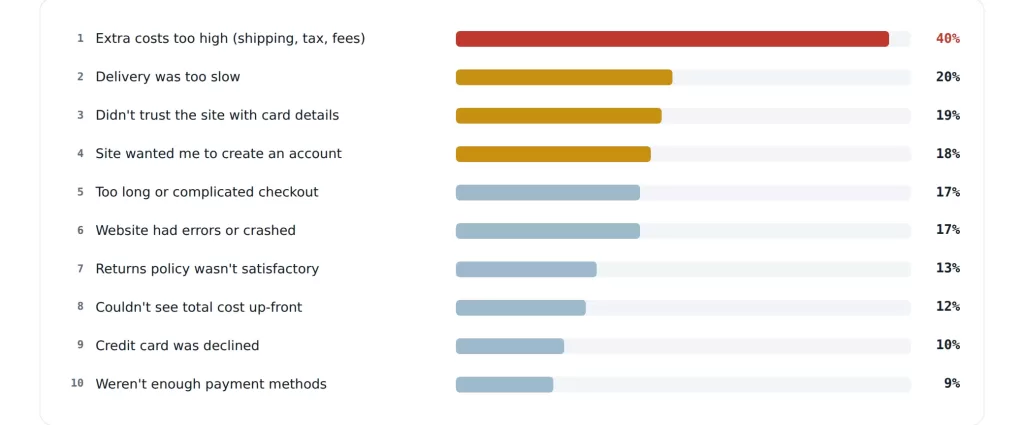
Checkout problems, by a wide margin. Baymard’s research asked shoppers why they abandoned, and the answers cluster heavily around cost transparency and checkout friction.
Baymard Institute, reasons for abandoning at checkout, US shoppers. Shoppers could pick more than one reason, so these do not sum to 100%. The “just browsing, not ready to buy” response (42%) is excluded, because it is not a fixable design problem. Everything shown here is.
The number most articles quietly drop Delivery too slow ranks second at 20%, above forced accounts and above checkout length. It is rarely on a CRO checklist because it is not a design fix, but if your shipping options are slower than the category norm, no amount of checkout tidying will recover those shoppers.
How do I use this checklist?
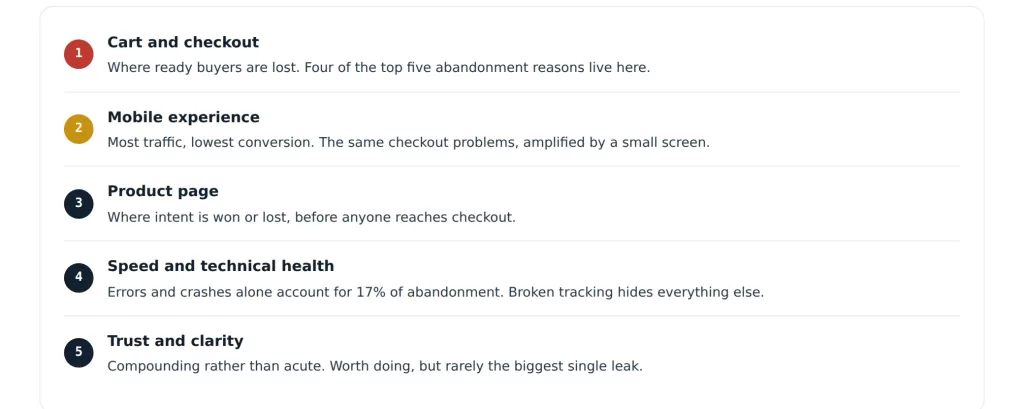
Work top to bottom, but fix in order of impact, not appearance. Checkout and mobile issues lose the most sales, so start there.
Conversion problems are not equal. A broken mobile checkout costs far more than an inconsistent button colour. Scan the whole list, note what applies, then fix the highest-impact items first. To find which is costing you the most, pair this with how to diagnose Shopify conversion issues.
This is the order of expected impact, not the order the checklist appears in below. Your own analytics may reorder it, and should.
The checklist
Five groups, each with a priority level. Tick what applies to your store, then fix in the order above.
Surprise costs
The number one trigger, cited by 40% of abandoners. Show shipping and fees early, on the cart page.
Slow delivery options
Second at 20%. Offer a faster tier, and state delivery dates rather than vague ranges.
Weak trust at payment
Card-security worries drive 19% away. Add security badges, returns terms, and real contact details.
Forced account creation
Drives away 18%. Offer guest checkout, and invite account creation after the order.
A checkout that is too long
Complexity loses 17%. Cut to essential fields and enable autofill.
Total cost hidden until the end
12% abandon because they could not calculate the total up-front. Show a running total.
Too few payment options
9% abandon for this. Add wallets like Shop Pay, Apple Pay and Google Pay.
Add-to-cart below the fold
Keep the primary action visible without scrolling. A sticky bar helps.
Checkout friction on small screens
Enable autofill and wallet payments so nobody types a card number on a phone.
Tap targets too small
Cramped controls cause misfires and frustration on the highest-traffic device.
Layout that breaks
Test on real devices, not a shrunk desktop preview.
Weak or buried add-to-cart
The primary action should be visible without scrolling, especially on mobile.
Thin product information
Missing sizes, materials, shipping or returns creates hesitation.
Poor or few images
Images do the selling. Show scale, detail and use.
No social proof
Reviews and ratings reduce perceived risk at the decision point.
Unclear pricing
Confusing prices or promotions stall shoppers mid-decision.
Website errors or crashes
Cited by 17% of abandoners, level with checkout complexity, and far more damaging.
Slow load times
Compress images, limit heavy apps, and audit your theme.
Poor Core Web Vitals
See the thresholds below. Failing them costs conversions and rankings.
Weak returns or shipping policy
An unsatisfactory returns policy is cited by 13% of abandoners. Uncertainty is a silent conversion killer.
No clear value proposition
Visitors should grasp what you sell, and why yours, within seconds.
Missing trust signals
Reviews, guarantees, policies and real contact details.
No genuine reason to act
Real clarity on stock or shipping cutoffs, not fake countdown timers.
Percentages are Baymard’s abandonment reasons, shown against the checklist item each one maps to. Items without a percentage are established usability practice rather than survey findings.
What are the Core Web Vitals thresholds?
Three metrics, each with a pass mark. Google publishes them, and failing any one is worth fixing before you test anything else.
LCP
< 2.5s
Largest Contentful Paint. How fast the main content appears.
INP
< 200ms
Interaction to Next Paint. How quickly the page responds to a tap.
CLS
< 0.1
Cumulative Layout Shift. How much the page jumps while loading.
Google’s published “good” thresholds, measured at the 75th percentile of real user visits. Mobile and desktop are assessed separately, so check both.
What should I fix first?
Start with checkout and mobile, where committed buyers are lost in the largest numbers. Then work back up to product pages, speed, and trust.
The honest shortcut: if you only fix a few things, fix your mobile checkout. It combines your highest-traffic surface with the place ready buyers abandon. After that, let your own data set the order, which the diagnostic guide helps you read.
How Fracto approaches this
We find your worst leak, then fix down the list.
A checklist tells you what to look at; your data tells you what is actually costing you. We combine the two, diagnosing which items on this list are hurting your store most, then fixing them in impact order.
On one engagement, that approach lifted a client’s conversion rate by 6% and revenue per visitor by 7%, both A/B tested at 95% confidence.
// we would rather show up in your reporting than in your inbox
Frequently asked questions
Sources
Cart and checkout abandonment reasons, US shoppers, multi-select so figures do not sum to 100%. Ranked as shown, with “just browsing / not ready to buy” (42%) excluded because it is not a fixable design problem — Baymard Institute.
Core Web Vitals thresholds: LCP under 2.5s, INP under 200ms, CLS under 0.1, assessed at the 75th percentile of real user visits — Google.
Fracto client engagement: +6% conversion rate, +7% revenue per visitor, A/B tested at 95% confidence.