Performance / Shopify
How Shopify Speed Impacts Conversion Rate
// the leak nobody looks for

By Fracto Solutions
July 27, 2026
The short answer
Shopify page speed affects conversion rate because slow pages lose visitors before they see a product. Ecommerce site speed is one of the few levers that improves rankings and conversions at the same time. In a Google and Deloitte study of 37 brands, a 0.1 second improvement in mobile speed lifted retail conversions by 8.4%. Google’s threshold for good loading performance is a Largest Contentful Paint under 2.5 seconds.
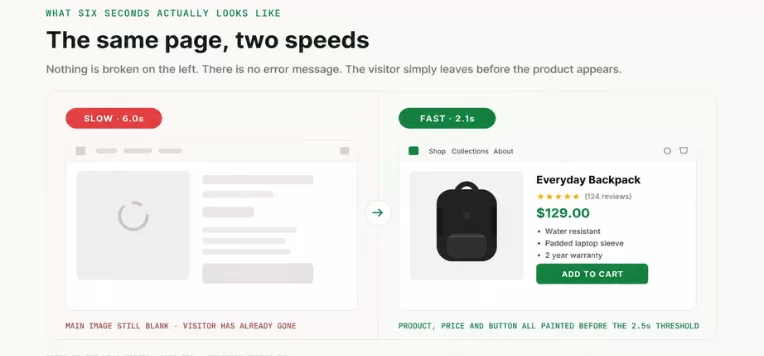
Speed is the leak nobody looks for, because it does not announce itself. Nothing is broken. There is no error message. Visitors simply leave a moment before your product image appears, and your analytics files it as a bounce.
Working through why your store gets traffic but no sales? Speed is worth ruling out early.
Does site speed actually move revenue, or just scores?
Revenue. The most rigorous study on this measured real money, not lab scores.
Google commissioned Deloitte to isolate site speed as a variable across 37 retail, travel, luxury and lead-generation brands in Europe and the US, covering roughly 30 million user sessions. A 0.1 second improvement in mobile site speed produced:
- Milliseconds Make Millions — Deloitte × Google
Vertical
Effect of a 0.1s mobile speed improvement
Retail
Conversions +8.4%, average order value +9.2%
Travel
Conversions +10.1%
Luxury
Product page to add-to-basket progression +40.1%
Lead generation
Bounce rate improved 8.3%
The interval is the striking part. One tenth of a second is below conscious perception, and it still moved every step of the funnel.
Two individual cases published on Google’s own web.dev support it. Vodafone Italy improved Largest Contentful Paint by 31% and measured 8% more sales in a controlled A/B test on otherwise identical pages. Rakuten 24 saw conversion rate rise 33.1% and revenue per visitor 53.4% after passing Core Web Vitals.
How fast does a Shopify store actually need to be?
Fast enough to load its main content in under 2.5 seconds for most real visitors, which is Google’s own “good” threshold.
- Google's Core Web Vitals thresholds
Metric
What it measures
"Good" threshold
Largest Contentful Paint (LCP)
How long until the main content appears
Under 2.5s
Interaction to Next Paint (INP)
How quickly the page responds to taps
Under 200ms
Cumulative Layout Shift (CLS)
How much the layout jumps while loading
Under 0.1
Two details matter more than the numbers. All three are judged at the 75th percentile, so being fast for most people is not enough; you need to be fast for three quarters of them. And Google uses field data from real visitors, not the lab score from a test on your own laptop. A store can look respectable in a synthetic test and still fail on real mobile connections.
Core Web Vitals have been a confirmed ranking signal since Google’s 2021 page experience update, so slow stores lose twice: fewer visitors convert, and fewer arrive in the first place.
What actually makes a Shopify store slow?
Commonly three things: images, apps, and the theme.
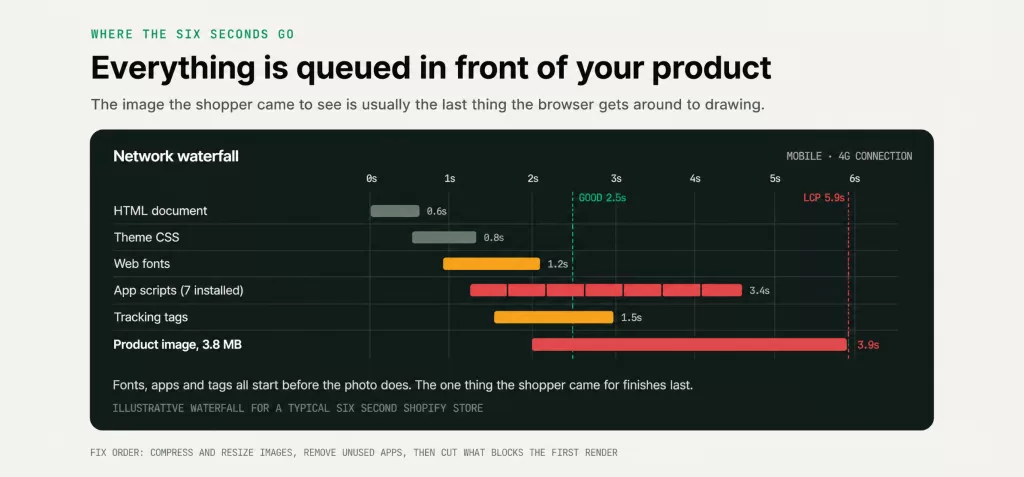
Images are typically the heaviest single element, particularly product photography uploaded at full resolution and served that way to phones. Apps are the quiet accumulator, because every one injects scripts, and most stores carry several they no longer use, often loading on every page when they matter on one. The theme and third-party scripts make up the rest: carousels, extra fonts, chat widgets, pop-ups, and tracking tags all competing for the same main thread.
My store loads in six seconds. How do I speed it up affordably?
Start with the free work, in order of return: compress and resize images, remove unused apps, then cut what blocks the first render.
Run your store through PageSpeed Insights first, on mobile, and read the field data section rather than the headline score. That tells you which metric is actually failing, so you fix the right thing.
Two rules make this safe. Work on a duplicate theme, never on the live store, because speed work breaks things and it should break somewhere that cannot cost you orders. And re-measure with real-user data afterwards, not a one-off lab score.
If you do all of that and still fail, the problem is usually structural, a bloated theme or heavy custom code, which is where development work is the honest answer rather than another plugin.
The Shopify page speed fixes that work first
Run Google PageSpeed Insights on mobile before making any changes, and use its report to identify the actual issues instead of following a generic checklist.
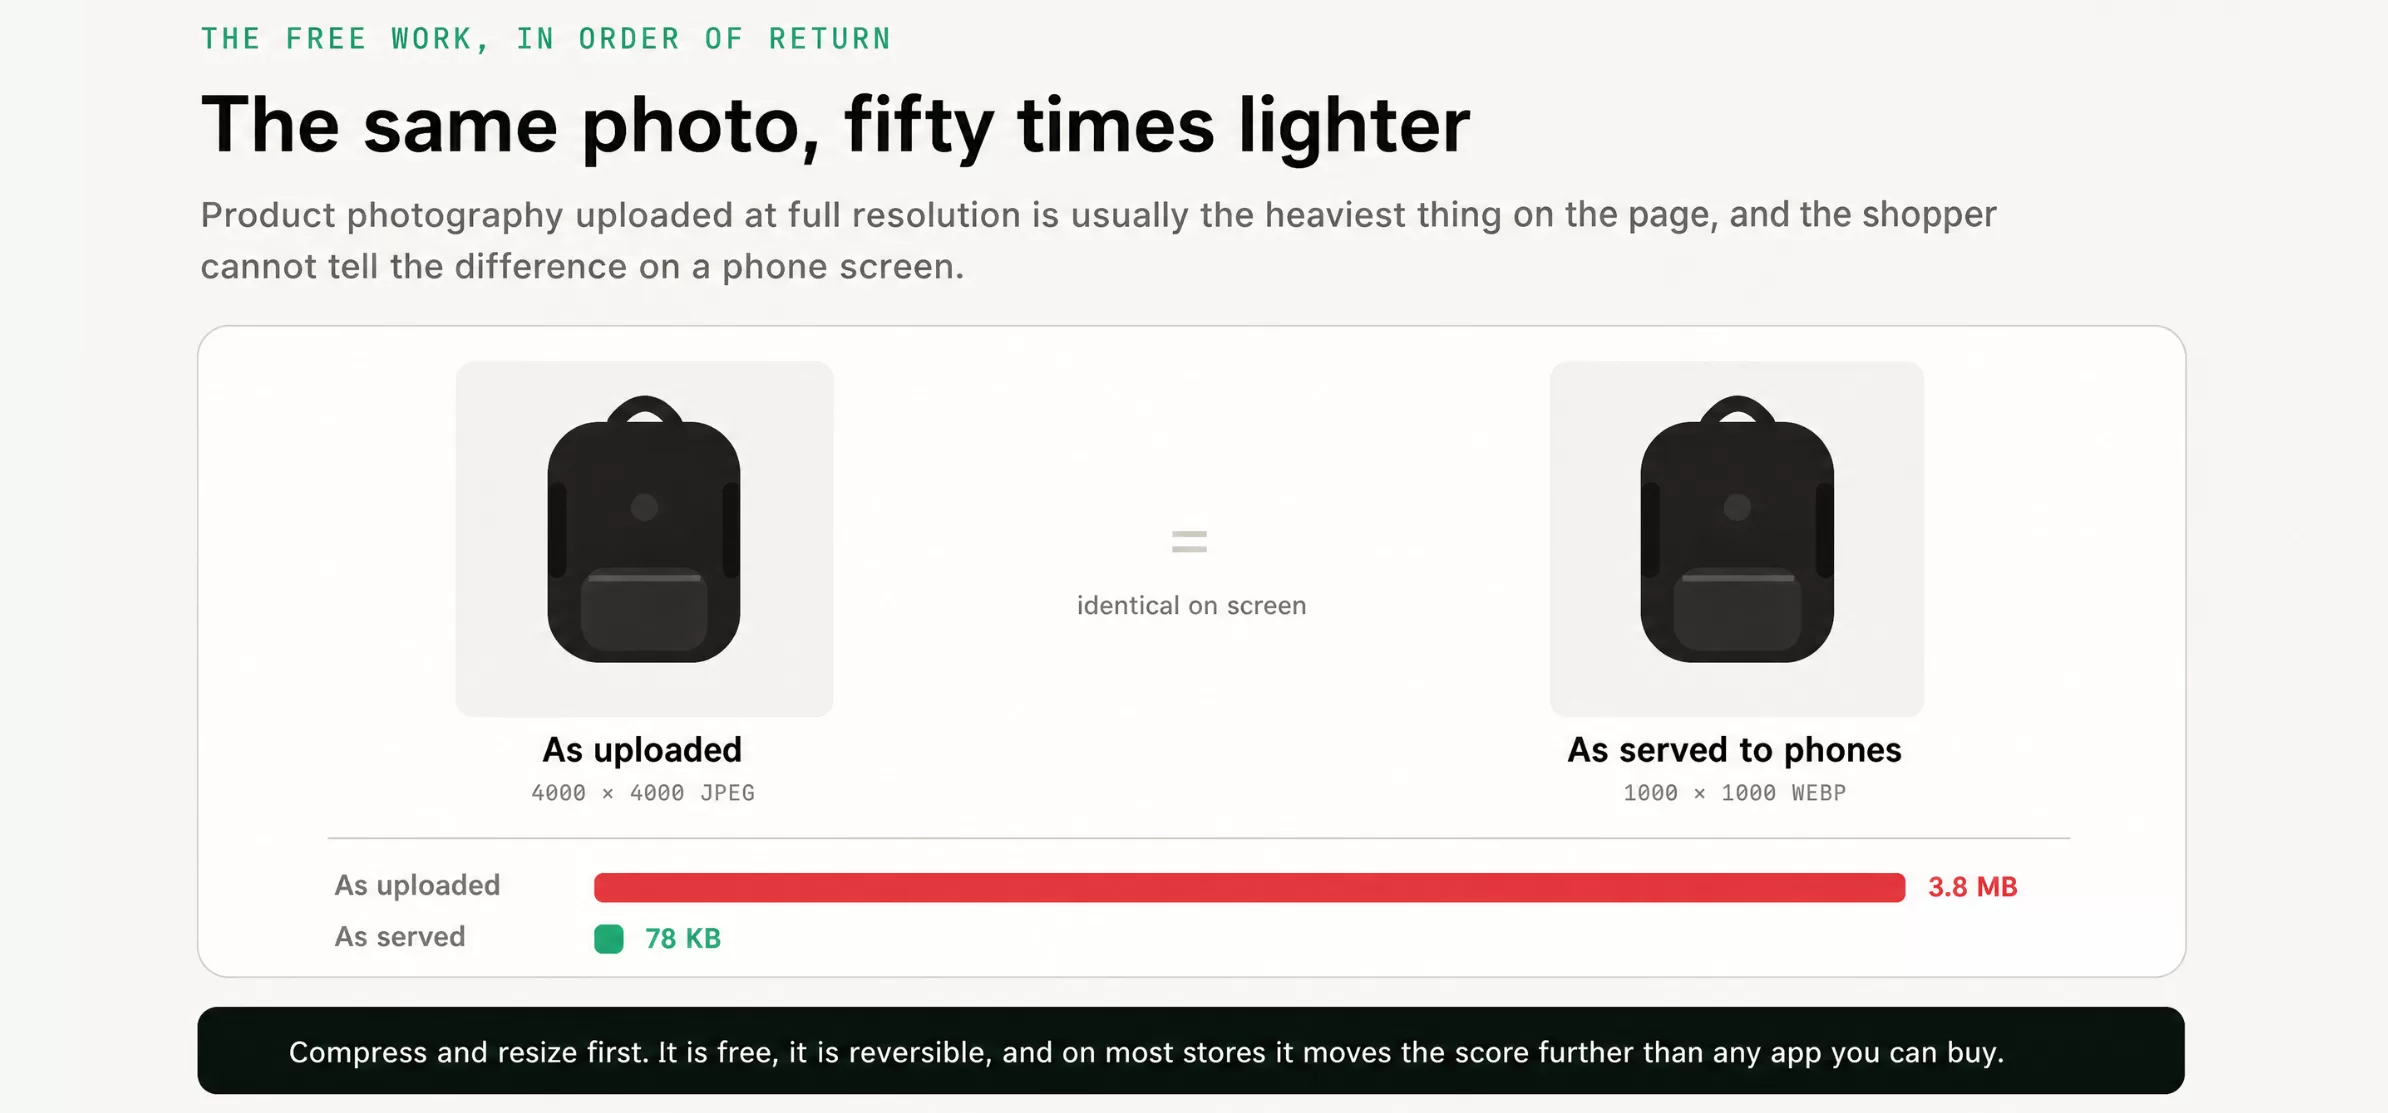
Start with images, as they are often the biggest opportunity for improvement. Product images should be exported at the size they are actually displayed, converted to WebP, and compressed before uploading. For example, serving a 3,000-pixel-wide hero image to a 400-pixel-wide mobile screen adds unnecessary file size to every visit.
Next, enable lazy loading for images that appear below the fold. These images do not need to load before the first screen is visible. Most modern Shopify themes already support lazy loading, while older themes may require the loading attribute to be added through the theme code.
You should also audit your apps and script tags. Every installed app can add scripts to the storefront, and sometimes scripts from apps that have already been removed remain in the theme code. Check the page source and identify any scripts belonging to tools you no longer use.
Then look at render-blocking CSS and JavaScript. Fonts, carousels, chat widgets, and other third-party scripts can load before the important content on the page. Deferring non-critical CSS and JavaScript can improve loading performance without changing the visual design of the page.
Finally, check the file sizes and performance of every major page type, including the homepage, collection pages, product pages, and cart. Different pages load different assets, so a store may perform well on the homepage while still having serious performance issues on product or collection pages.
After making each change, run the test again instead of changing everything at once. This makes it easier to understand which improvement actually helped. Page speed improvements often build up gradually, and several small improvements across different page types can create a better overall experience than one major optimization focused only on the homepage.
How much difference does fixing it actually make?
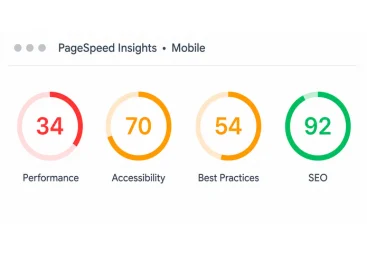
Enough to change the grade entirely. On one client site we optimized, mobile performance went from 34 to 87 and desktop from 47 to 95, in a single engagement.
- One client engagement, before and after
- Before
- After
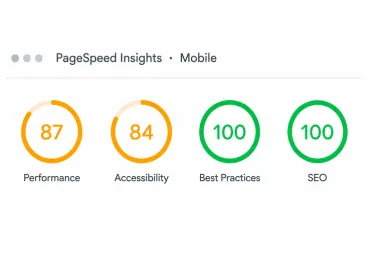
- Before
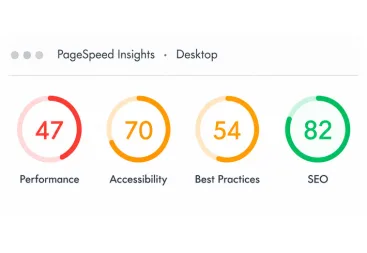
- After
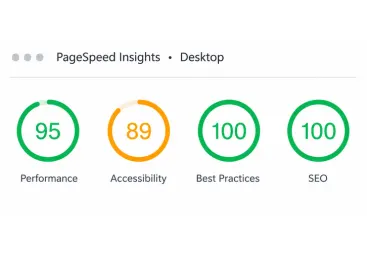
Real PageSpeed Insights reports from one client engagement, taken the same day, before and after the optimization pass. Store name cropped from frame.
The starting point was worse than the score suggests. Largest Contentful Paint on mobile was 28.8 seconds, more than ten times Google’s threshold. In practice the main content was not appearing until long after almost everyone had given up.
Results like that are not unusual for a site that has never had speed work done. They look dramatic because the baseline was so poor, which is the point: most stores have never audited this, so the first pass finds a lot.
We find the leak, fix it, and prove the gain in your own numbers.
We audit your data, funnel, and channels to find where revenue is actually leaking, fix the biggest leaks first, then validate the lift in your own analytics rather than a vanity dashboard.
Frequently asked questions
Does site speed affect Google rankings or just conversions?
Both. Core Web Vitals have been part of Google’s page experience signals since 2021. It acts as a tiebreaker rather than a dominant factor, so strong content still matters more, but between two similar pages the faster one has the advantage.
Why does my Lighthouse score look fine when the site feels slow?
Lighthouse gives lab data from a simulated run. Google ranks on field data from real visitors on real devices and connections. Check the field data section in PageSpeed Insights before deciding you are fine.
Is it worth paying for a speed optimization service?
Do the free work first. Images, an app audit, and script cleanup usually recover most of the loss. Pay for help when you have done that and still fail, which normally means the theme or custom code needs engineering rather than tuning.
How fast is fast enough for mobile?
Aim for Largest Contentful Paint under 2.5 seconds for at least 75% of real visitors. Mobile is the harder target and usually the larger share of traffic, so judge yourself there rather than on desktop.
Keep reading
Sources
Deloitte and Google, Milliseconds Make Millions (2020): 0.1s mobile speed improvement lifted retail conversions 8.4% and AOV 9.2%; travel conversions 10.1%; across 37 brands — web.dev
Google Search Central, Understanding Core Web Vitals: LCP under 2.5s, INP under 200ms, CLS under 0.1 — developers.google.com
web.dev case studies: Vodafone Italy (31% LCP improvement, 8% more sales, A/B tested); Rakuten 24 (+33.1% conversion rate, +53.4% revenue per visitor).
Fracto client engagement, PageSpeed Insights before and after (May 2026): mobile 34 to 87, desktop 47 to 95, baseline mobile LCP 28.8s.