The client wanted an answer to a deceptively simple question: were its marketing campaigns actually driving incremental sales, or was it paying for growth that would have happened anyway?
Convenience retail makes that question unusually hard to answer honestly. Store counts fluctuate week to week. New stores enter the network mid-campaign. Seasonal and market-wide swings move every brand at once, so a rising sales line can look like a marketing win when it is really just the tide coming in.
Raw sales totals conceal as much as they reveal. The brand needed a measurement approach rigorous enough to survive scrutiny at CMO and CEO level, and disciplined enough to tell a real, defensible gain apart from a swing that merely resembled one.
How the program is phased
Two phases across three metropolitan markets in one large US state, launching only as results supported the next step.
| Phase | Design | Status |
|---|---|---|
| Phase 1 | One metro market. 49 test stores against 43 matched control stores; 8-week flight plus 6-week post-campaign observation. | Complete. +22.5% cumulative incremental lift, certified at store level. |
| Phase 2 | Two further metro markets and a second retailer. The lead market runs a dual-control design; the second is read on footfall-normalized velocity. | In flight. No decision-grade campaign read yet; a chain-wide promotion overlaps the window. |
We designed a controlled-market sales lift study built on a difference-in-differences framework. The core metric was velocity per outlet: units sold divided by active stores per week, where an active store is one that sold at least one unit. We used no zero-padding, so the denominator could not be quietly inflated.
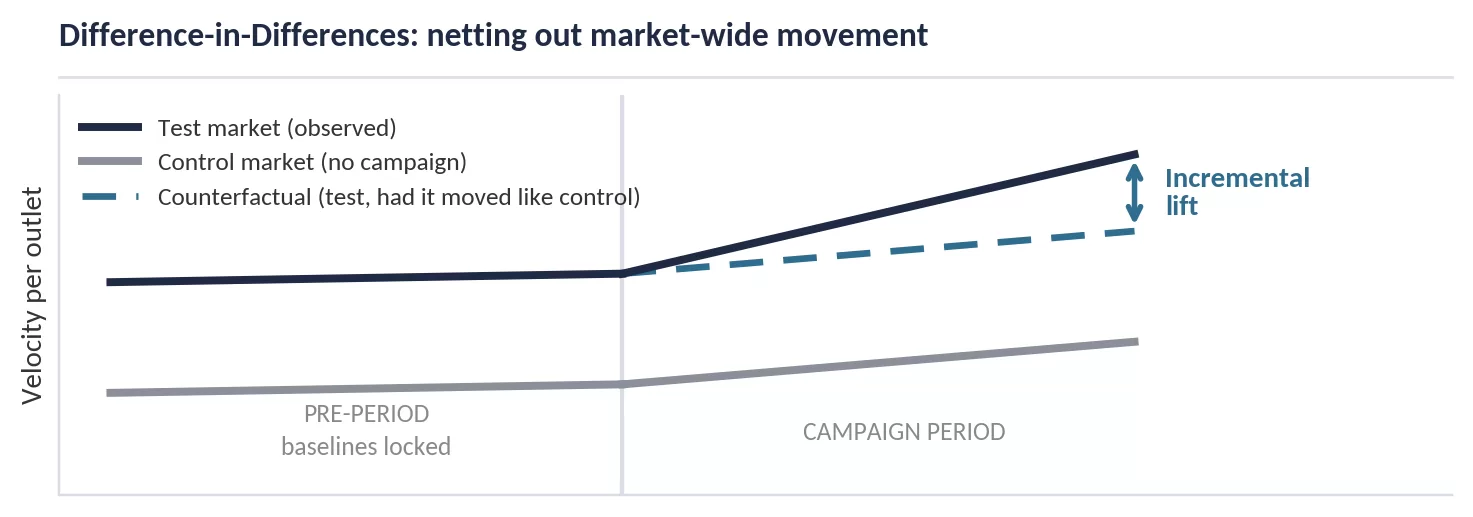
Figure 1. The difference-in-differences framework. Only the gap between observed test performance and the counterfactual is credited as lift; movement shared with the control market is netted out.
Test stores in the campaign market were measured against a matched control market that received no campaign, so any movement common to both could be netted out rather than credited to the campaign. Pre-campaign baselines were locked before launch and treated as inviolable, which meant the before number could never drift later to flatter the after.
Cold-recomputation. Every published figure was recomputed from raw point-of-sale exports before it was certified. Nothing was carried forward on trust from a prior week or a spreadsheet header.
Cohort integrity. Newly added stores were excluded so the measured group stayed consistent from baseline through the campaign.
No pooling across incomparable formats. Where two retail chains carried sharply different per-store volumes, their data was never combined into a single read that a blended average could distort.
Traceability. No number went out that could not be traced back to source data.
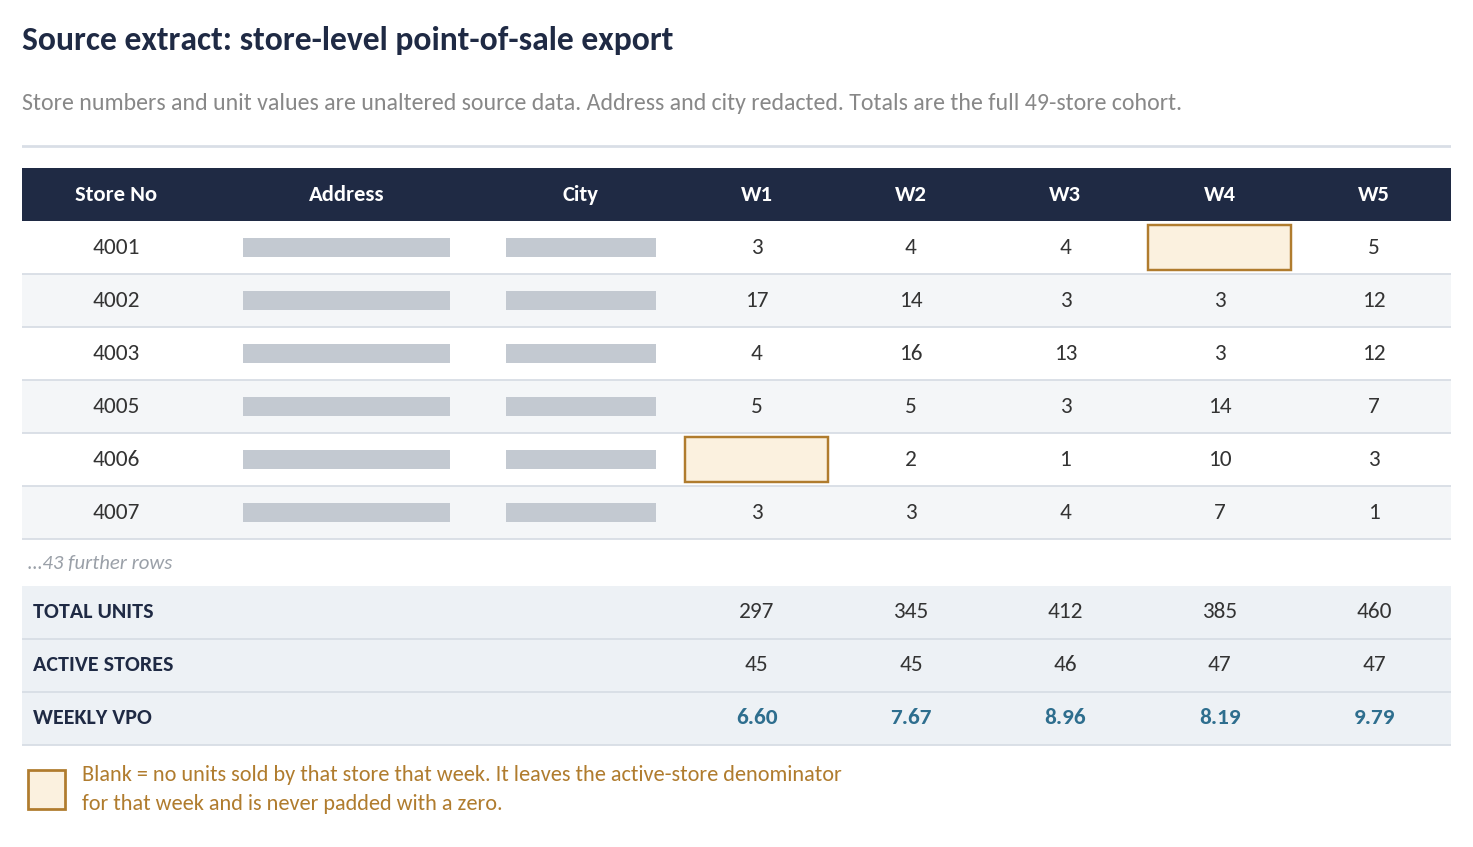
Figure 2. An extract of the store-level point-of-sale export the study reads from. Store numbers and weekly unit values are unaltered source data; address and city are redacted. The highlighted blanks are why velocity is measured per active store: a store with no sale that week leaves the denominator rather than entering it as a zero.
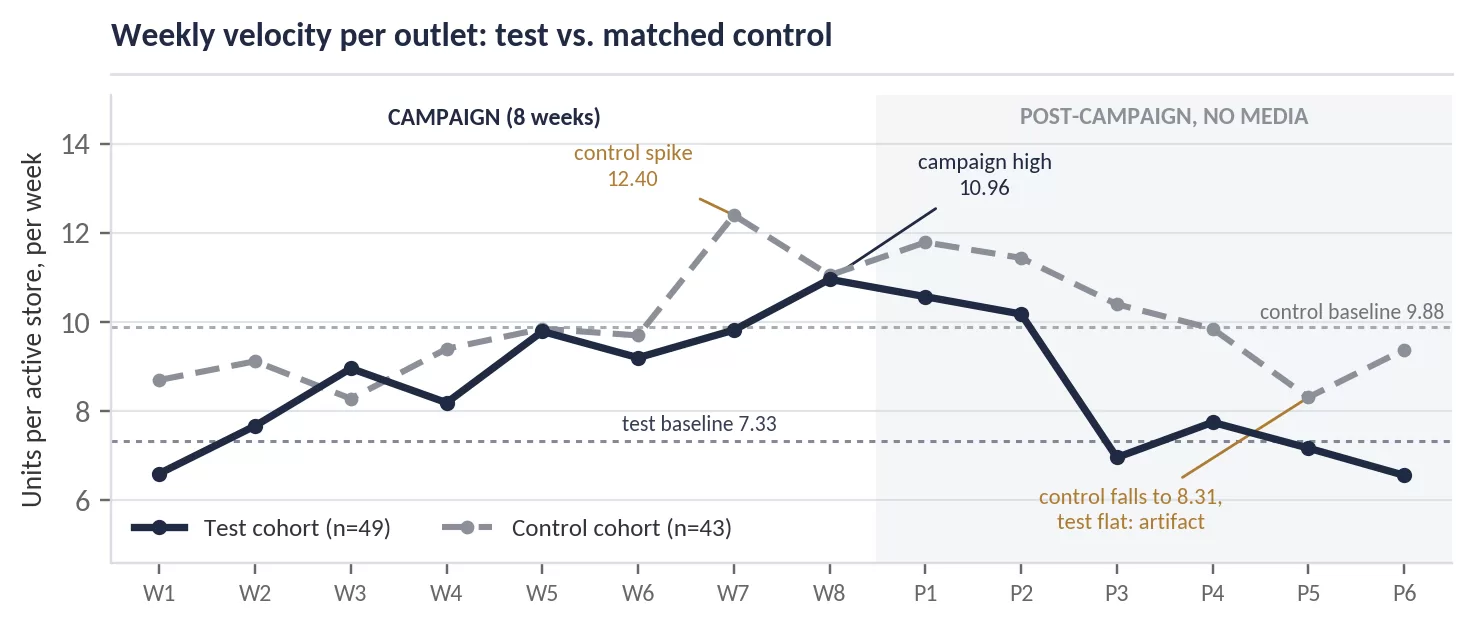
We drew a clean cohort of 49 test stores against 43 control stores from a shared retail division, in a control market far enough away to keep campaign media out of it. The two groups entered the test correlated at r = 0.898 across the pre-period. We locked a 26-week pre-campaign baseline before launch, then tracked store-level velocity weekly through an 8-week flight and a 6-week post-campaign observation window.

Figure 3. Weekly velocity per outlet, 49 test stores against 43 matched control stores, across the 8-week campaign and the 6-week post-campaign observation window. Baselines are the locked 26-week pre-period averages. Active-store denominators, no zero-padding.
Test velocity climbed from a 7.33 baseline to a campaign high of 10.96 units per active store, while the control market moved on its own path, including a sharp one-week rise in Week 7 that had nothing to do with the campaign. Netting one against the other is what separates the campaign’s contribution from the market’s.
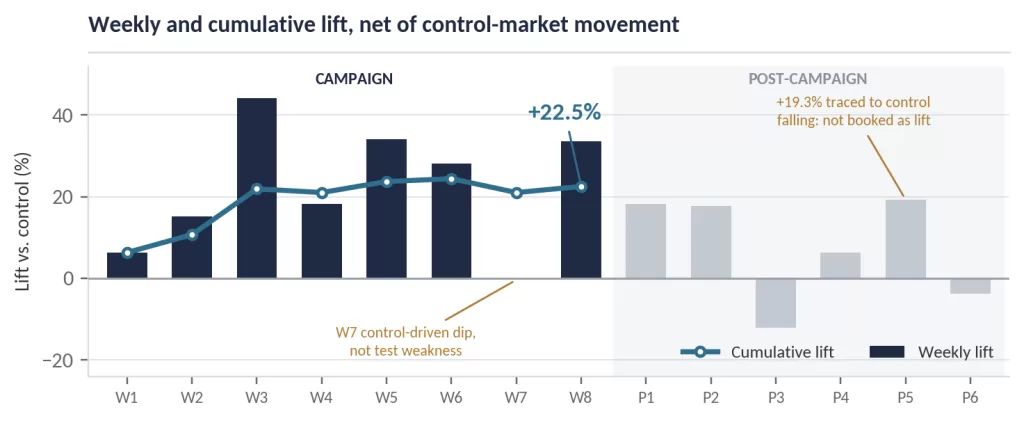
+22.5% cumulative incremental lift over the 8-week flight, net of control-market movement and backed at the store level by locked baselines and cold-recomputed velocity.
The lift outlived the media. In the first two weeks after all advertising stopped, test velocity held +18.2% and +17.7% against the control, roughly 42% above baseline, before normalizing to a +7.5% control-adjusted average across the six-week observation window.
Sales that rise with media, carry briefly and then settle back are the signature of a campaign effect rather than a background trend.
A false positive was caught inside the observation window. One week read +19.3% against the control, but the movement traced to the control market falling while test stores sat at baseline. It was labeled a control artifact rather than credited to the campaign.
Phase 2 expands the program into two further metropolitan markets and a second retailer, timed to a major sporting event activation. The lead market is where the campaign read sits: its tracked network is roughly three times the size of Phase 1 and is measured against two separate controls rather than one — an in-market panel carrying no campaign (r = 0.957) and an external control market (r = 0.908).
The two are never pooled. A panel inside the test market shares its local conditions while an external market does not, so reading them separately is what makes it possible to tell a local effect from a market-wide one. The second market carries too few register-fed stores for a clean difference-in-differences read, so it is measured on footfall-normalized velocity instead, and is never blended into the lead market’s numbers.
For much of the current flight a chain-wide promotion has run across every market, including markets carrying no campaign at all. That makes raw weekly movement unusable as a campaign read: velocity rose in the tracked cohort, and rose harder in the control.
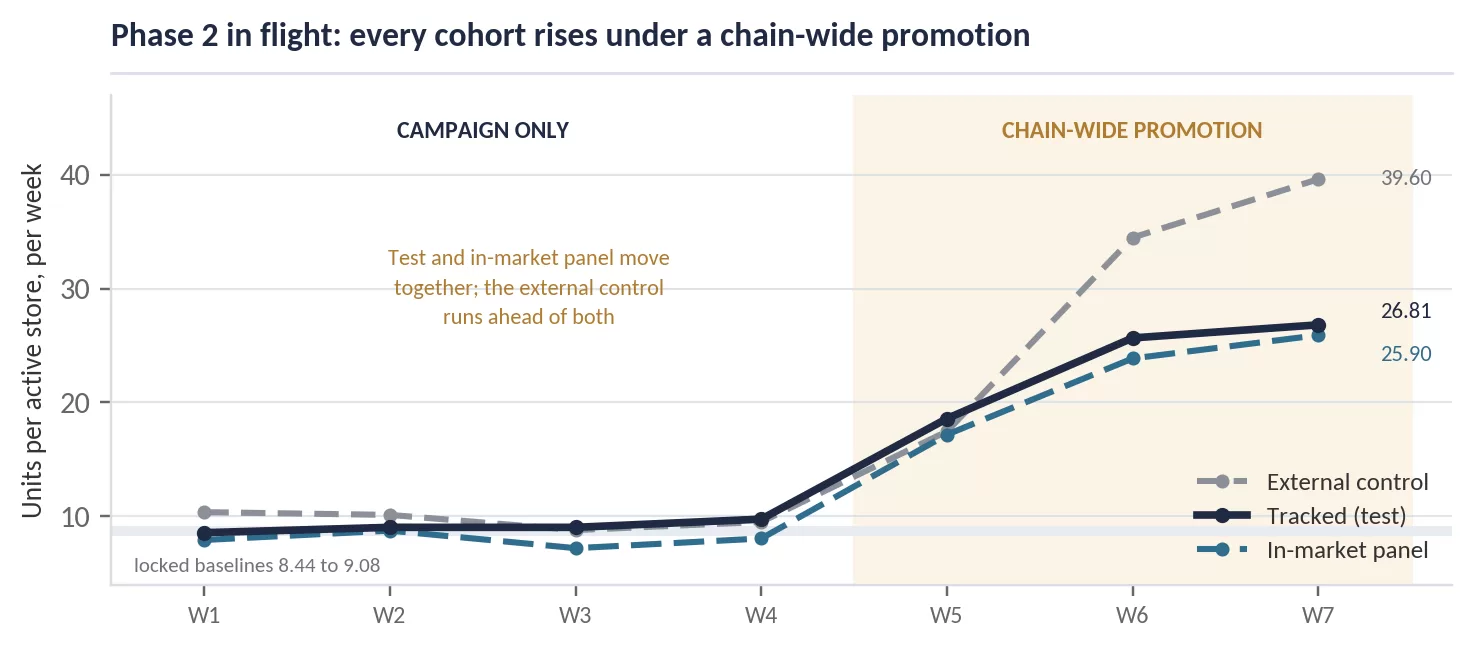
Figure 4. Phase 2 lead market, in flight. From Week 5 a chain-wide promotion runs in every market, including markets carrying no campaign, and all three cohorts rise. Nothing is booked as lift from these weeks, because they measure the offer rather than campaign contribution
Nothing has been booked as lift while the promotion is live. Reporting the rise would have been easy, and wrong. A number published now would have to be withdrawn later, which costs more credibility than the delay does.
One comparison still isolates the campaign. The tracked cohort against the in-market panel shares both the market and the promotion, so what remains between them is the campaign. On that basis the campaign is holding level through a heavy promotional period.
The external control read is explained, not reported. A small control concentrates volume in a few stores, so it swings. Where that drove a number, we said so in plain language rather than letting the number stand on its own.
The decision-grade read arrives with the first clean post-promotion week. The client knows that, knows what the read will be measured against, and knows what would change the recommendation.
That is the point of the phasing: spend scales on a confirmed result, not on a hopeful one.
Why the delay is the deliverable
Tools & technologies
verified